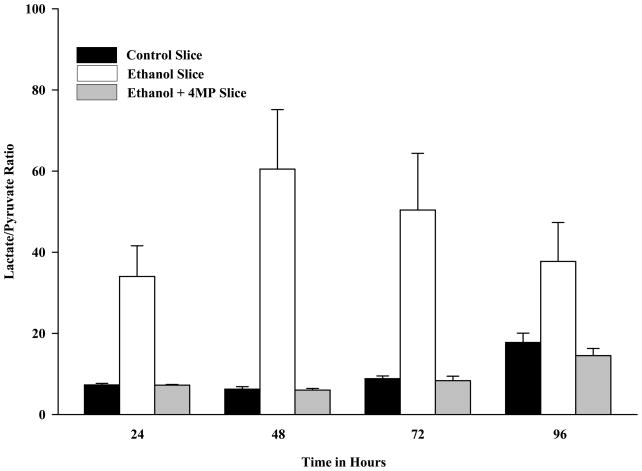
Figure 6.
Redox Ratio (Lactate/Pyruvate) in Rat Precision-Cut Liver Slices. PCLS were cultured at 24, 48, 72 and 96 hours in the absence of ethanol (Control-solid bars), presence of 25 mM ethanol (Ethanol-open bars), and in the presence of both 25 mM ethanol and 0.50 mM 4-MP (Ethanol + 4-MP-shaded bar). At the various time points the Lactate and Pyruvate concentrations were determined and the redox ratio calculated. The Control + 4-MP group were not different from the Control PCLS (Data not shown). The cellular redox state was determined as described in the Materials and Methods. Data are expressed as the mean lactate/pyruvate (NADH/NAD+) ratio ± S.E.M. of five separate experiments. Significantly increased for Ethanol treated PCLS compared to all other groups, *P < 0.01.

