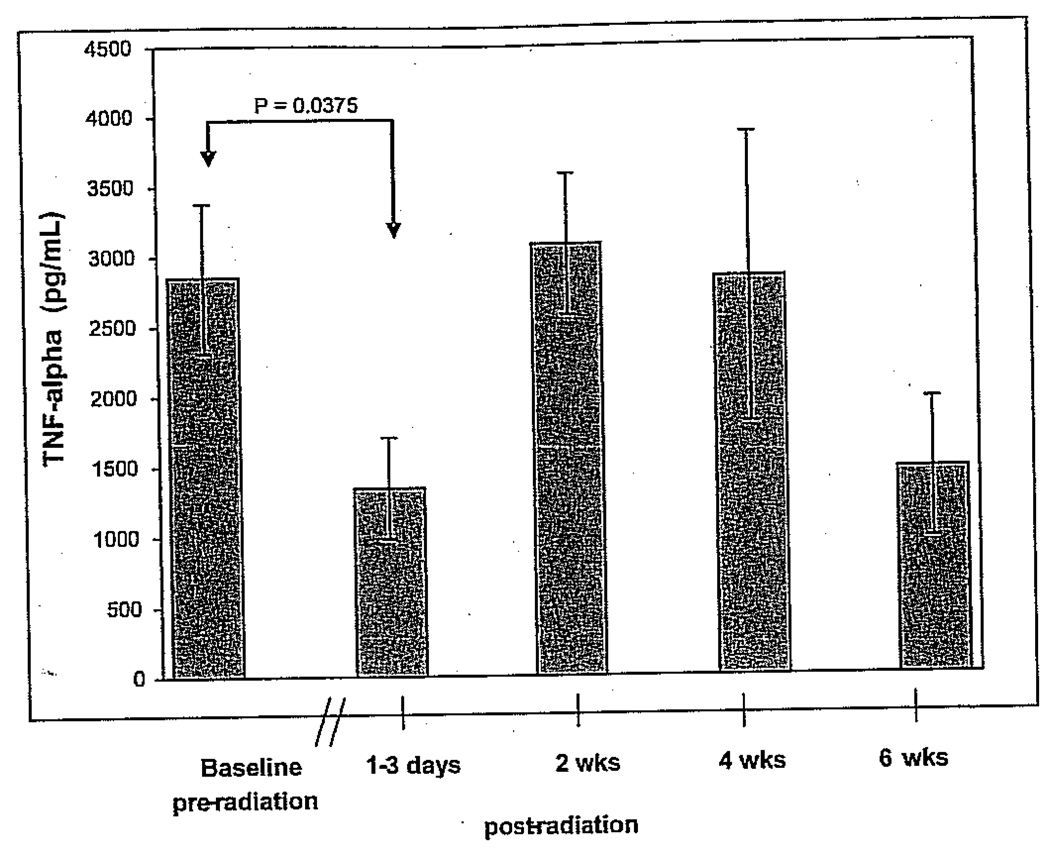
Figure 6.
PHA-stimulated tumor necrosis factor α (TNF-α) production in peripheral blood mononuclear cells at each study time point (mean ± SEM). Production levels between visit 1 (preradiation baseline) and visit 2 (postradiation) were significantly different. (When the four subjects recruited from the University of Minnesota were removed from analysis, the p value was greated than .05.)

