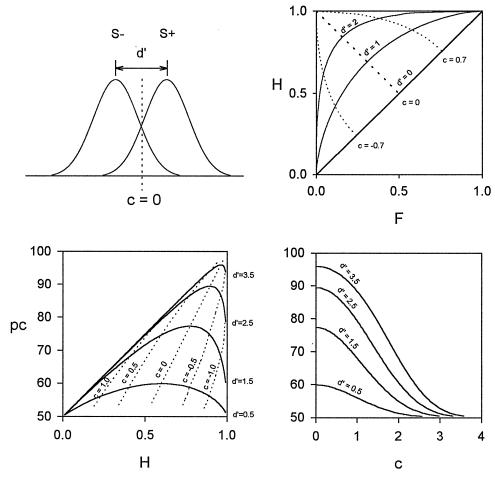
Figure 1.
Signal detection. (Top left) Two standard normal distributions represent a subject’s internal (neural) signals associated with absence of a stimulus (S−, left) and presence of a stimulus (S+, right). The subject must chose a criterion above which he should respond “S+” and below which he should respond “S− .” As the distributions overlap, judgements based on any criterion will result in some misidentifications, yielding some errors (false alarms and misses) as well as correct responses (hits and correct rejections). The subject’s sensitivity, d′, in units of SD, is given by d′ = z(H) − z(F) where hit rate, H, = number of hits/(number of hits + misses) and false alarm rate, F, = number of false alarms/(number of false alarms + correct rejections) and z is the inverse of the normal distribution function. When the subject cannot discriminate at all, H = F and d′ = 0. The subject’s criterion, c, is given by c = −0.5 [z(H) + z(F)] and is equal to 0 when false alarm and miss (M) rates are equal, negative when F > M, and positive when F < M. Thus, c is a measure of response bias, the tendency of the subject to say S+ irrespective of the actual number of S+s presented. (Top right) The relation between sensitivity and response bias, or ROC, represented as plots of hit rate vs. false alarm rate. Curves deviating from the major diagonal represent lines of isosensitivity, which describe the relation between hit and false alarm rates as bias changes at constant sensitivity. Curves deviating from the minor diagonal represent lines of isobias across the range of sensitivities. (Bottom) Variation of percentage correct with hit rate (left) and response criterion (right) at various fixed sensitivities calculated from SDT given that S+ and S− have equal probabilities of presentation. The latter graph is symmetric about the c = 0 line. The graphs show how the performance of a subject with constant sensitivity could vary between 50 and 95% correct depending on the subject’s response criterion.

