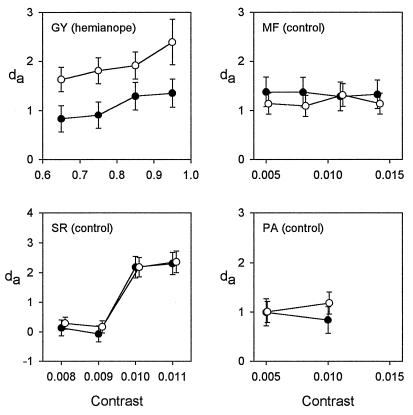
Figure 3.
Sensitivity as a function of stimulus contrast for yn (black circles) and 2afc (white circles) detection tasks in the hemianopic subject and three control subjects. Data were plotted only if ROCs could be fitted adequately to responses at the P < 0.01 level. Error bars indicate 95% confidence limits. Note the different contrast scale for G.Y. and the control subjects.

