A SERS-based thermometer for the photothermal effect
The conformation of molecules on a metallic nanoparticle’s surface is sensitive to temperature variations and can be easily monitored in situ by SERS. Excitation of the metallic nanoparticle for SERS can concurrently induce a photothermal effect whereby the light absorbed by the nanoparticle is released as heat. From the SERS spectra, we could derive the changes in temperature at the surface of a nanoparticle during the photothermal effect.
Keywords: Photothermal effect, self-assembled monolayer, SERS, nanoparticles, and interface
Surface-enhanced Raman scattering (SERS) is a fascinating process by which normally weak Raman signals can be amplified by 8–10 orders in magnitude.[1] These large enhancements are mainly caused by the strong, light-induced electromagnetic-fields (E-fields) at the surface of a metallic nanostructure.[2] The superb sensitivity of SERS has shaped the mainstream view of this method as one primarily to be implemented for trace detection. Yet, SERS does not need single-molecule sensitivity to be useful. This is because SERS can reveal the structural information of molecules adsorbed on the surface of a Au or Ag nanoparticle. These surfaces continue to gain importance as nanoparticle engineering and surface functionalization become evermore sophisticated to meet the demands of new applications. One application where this surface plays a pivotal role is the photothermal (PT) effect. The PT effect occurs when a metal nanoparticle absorbs light and releases it as heat.[3] This heat can affect the molecules on the nanoparticle’s surface and heat up the local environment, both of which have been actively exploited for drug delivery,[4] cancer therapy,[5] and lithography applications.[6] In the PT effect, a nanoparticle’s surface plays a key role in its utilization as molecules are often released from this surface or change as a result of the released heat. Quantifying the heat released and the temperature gradients generated by the PT effect is therefore essential for engineering the nanoparticle and its surface for the aforementioned applications. While an array of techniques have been developed to quantify the PT effect over varying timescales, these approaches rely on indirectly inferring the heat generated by the PT effect through bubble formation,[7] ice melting,[8] theoretical computations,[9] and ultrafast absorption techniques.[10] Herein we show, for the first time, that SERS can be employed as a sensitive tool to probe the PT effect, leading to direct examination of the heat generated at the nanoparticle’s surface.
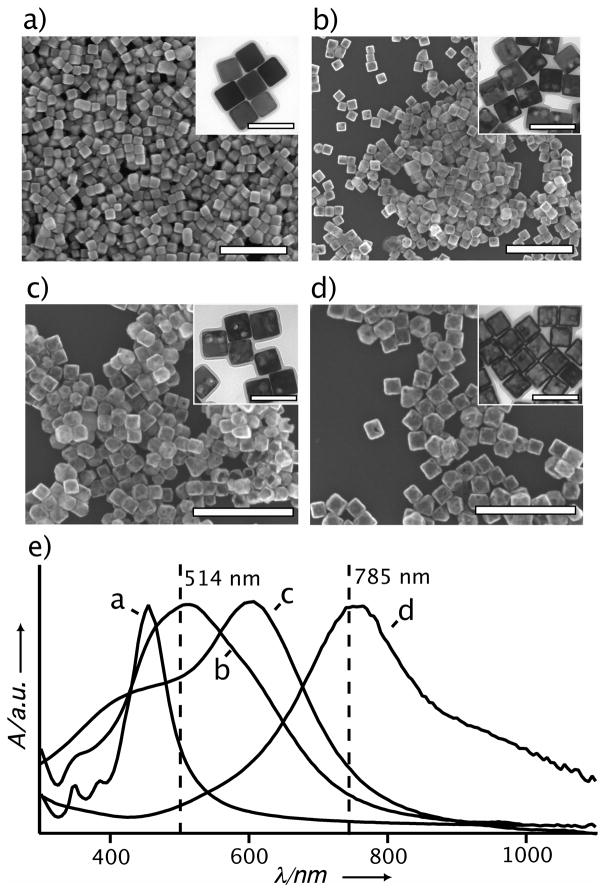
Both SERS and the PT effect share the same fundamental mechanism of plasmon excitation that generates strong local E-fields for SERS and heat for the PT effect, respectively. This same origin makes SERS a very simple and attractive technique for probing the PT effect without the involvement of sophisticated equipment or analysis. This simplicity is also a big advantage for nanoparticles having complex shapes, morphologies, and compositions, where modeling is rather complicated and assumptions about the nanoparticle’s parameters may become untenable. Figure 1 shows SEM and TEM images of the Ag nanocubes and Au-Ag nanocages used in the present work and their corresponding localized surface plasmon resonance (LSPR) spectra. Nanocages have been engineered as PT transducers for destroying cancer cells,[11] as carriers for controlling drug release,[12] and as contrast agents for optical imaging.[13] For these applications, pulsed or modulated lasers were typically used. These kinds of lasers are ideal for generating heat localized at the nanoparticle’s surface, ⊗Tnano, when the laser pulse is shorter than the time scale needed for the thermal fields of neighboring nanoparticles to overlap.[14] In the present work, the continuous wave (cw) lasers of a Raman microscope were used to excite the nanoparticles for both the SERS and PT effect.
Figure 1.
SEM and TEM images of the (a) Ag nanocubes and (b–d) Au-Ag nanocages used in this study. The scale bars are 500 nm and 100 nm for the SEM and TEM (inset) images, respectively. (e) Absorbance spectra taken from the Ag nanocubes and Au-Ag nanocages. The Au-Ag nanocages were prepared from the Ag nanocubes in (a) via the galvanic replacement reaction and the LSPR peak was tuned to (b) 525 nm, (c) 620 nm, and (d) 790 nm. The vertical lines in (e) correspond to the wavelengths of the excitation sources used for SERS. The well-defined LSPR peaks indicate that the particles were well dispersed in the solution phase although they may aggregate upon drying (as seen in the SEM images) due to the capillary force.
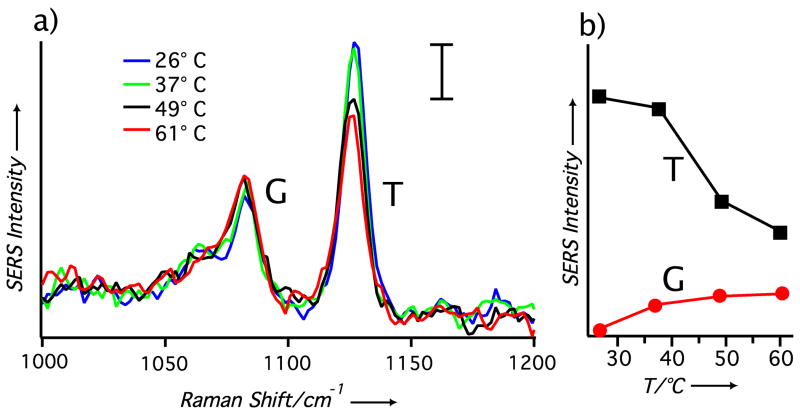
Since SERS directly measures the chemical structures of molecules on a metal nanoparticle, this technique can be used to determine the temperature at a nanoparticle’s surface by employing probe molecules with measurable, temperature-dependent structural changes. Self-assembled monolayers (SAMs) of alkanethiolates are sensitive to temperature changes and, as demonstrated recently, can serve as a molecular “thermometer” in the context of vibrational spectroscopy.[15] Figure 2 shows the SERS spectra of a 1-dodecanethiolate (1-DDT) SAM chemisorbed on Ag nanocubes (suspended in water). The 1-DDT SAM on Ag nanocubes has been characterized elsewhere and can be considered a highly ordered structure similar to that of an alkanethiolate SAM on an extended Au surface.[16] Figure 2a shows the SERS spectra acquired at different temperatures by manually increasing the temperature of the aqueous suspension containing 1-DDT-covered Ag nanocubes. The spectra show a clear change in relative intensity for the gauche (G, at 1080 cm−1) and trans (T, at 1125 cm−1) carbon-carbon stretch bands, v(C-C). As shown in previous studies, these two bands are sensitive to the conformation of the SAM with the v(C-C)T or T band associated with a low-energy conformation and indicative of a well-ordered monolayer. The G band is a high-energy conformation that can arise when the SAM becomes disordered due to an increase in temperature.[17] As the temperature of the solution was manually increased from 26 to 61 °C, the intensity of the v(C-C)G band increased while the v(C-C)T band decreased (see the plots in Figure 2b). This sensitive dependence suggests that SERS could be employed to detect small variations in temperature at a nanoparticle’s surface.
Figure 2.
(a) The SERS spectra of 1-DDT-covered Ag nanocubes in water at four different solution temperatures with 514 nm excitation. The temperature of the solution was adjusted with a temperature-controlled stage. Each spectrum contains the gauche (G, at 1080 cm−1) and trans (T, at 1125 cm−1) carbon-carbon stretch of the 1-DDT SAMs with the scale bar corresponding to 10.8 adu mW−1 s−1. (b) The relationship between temperature and peak intensities of the T and G bands, where an increase in the solution temperature causes the T band to attenuate and the G band to increase.
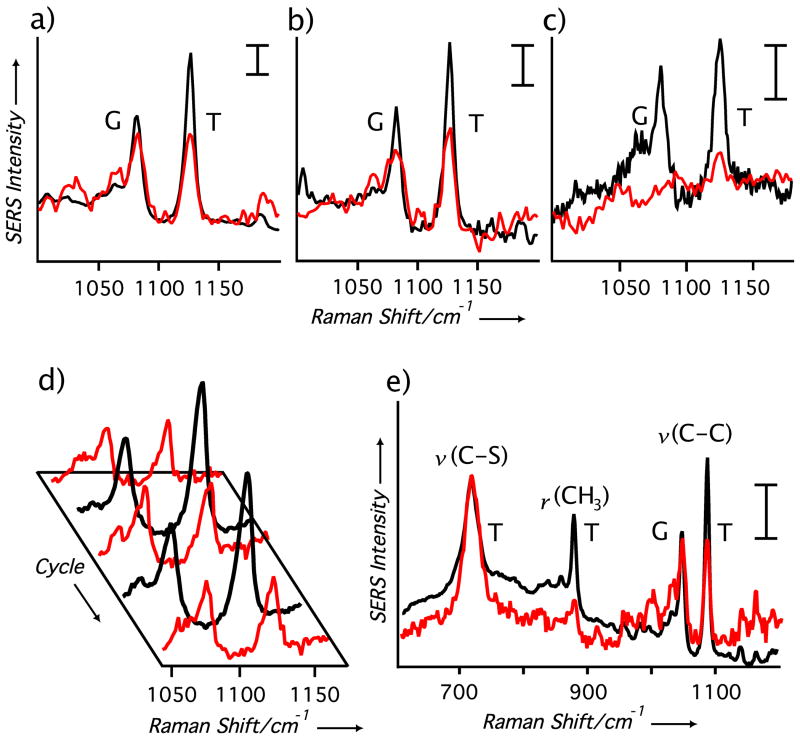
In Figure 3 the SERS spectra of 1-DDT SAMs adsorbed onto Au-Ag nanocages are shown at two different excitation wavelengths. What is immediately evident is the large discrepancy between the T and G band intensities at 514 and 785 nm excitations for all of the nanocage samples. This dependency demonstrates that the SAMs adopt different conformations contingent on the excitation wavelength. When the excitation overlaps with the LSPR of the nanocage, the SAMs become more disordered. The observed changes in intensity for the T and G bands cannot be attributed to the differences in excitation and LSPR wavelengths (as SERS can be sensitive to both parameters) because these two bands are only ~50 cm−1 apart. Furthermore, our recent SERS studies with Au-based nanocages found no such relationship, in which neighboring bands would change intensities with different excitations.[18] In Figure 3a, nanocages with an LSPR at 525 nm show significant disorder for 514 nm excitation but not 785 nm excitation. For the nanocages in Figure 3b, the LSPR was tuned to 620 nm and when excited with 514 nm laser the T/G intensity ratio decreased relative to the 785 nm excitation. Comparing the T and G bands in Figure 3a with Figure 3b, more disorder is evident for nanocages tuned to 525 nm than 620 nm under 514 nm excitation. In contrast, these excitation dependencies are not seen at all with Ag nanocubes (see Figure S1) due to their poor ability to convert light into heat (i.e., scattering is the dominant process).
Figure 3.
(a–c) The SERS spectra of 1-DDT-functionalized Au-Ag nanocages in water with 514 nm (red) and 785 nm (black) excitation, respectively. The LSPR of the nanocages was tuned to (a) 525 nm, (b) 620 nm, and (c) 790 nm. (d) The SERS spectra of 1-DDT-covered nanocages (LSPR: 525 nm) with 514 nm (red) and 785 nm (black) excitation in continuous cycles, showing the reversible nature of the trans-gauche conformational change. (e) SERS spectra of 1-DDT-covered nanocages (LSPR: 525 nm) showing other bands associated with the 1-DDT SAM with 514 nm (red) and 785 nm (black) excitation. The scale bars correspond to 14.0 adu mW−1 s−1. For all spectra, t = 120 s and Plaser = 4.5 mW for 514 nm, and 5.2 mW for 785 nm.
When the LSPR of the nanocages was tuned to 790 nm in Figure 3c, 785 nm excitation resulted in a disorder monolayer. For the 514 nm excitation, no SERS spectrum could be obtained. This has been a subject of an earlier study,[18] suffice to say here that with increasing Au content in the nanocages, interband transitions would effectively dampen the plasmon and attenuate the SERS signals.
For all the nanocages studied here, the excitation-depended changes seen in the spectra were reversible. Figure 3d shows five acquisitions taken in sequence of 1-DDT-covered nanocages. The reversible nature of this process shows that the collective heat generated by the nanoparticles was only limited to specific acquisitions and no increase in the solution’s temperature, ⊗Tglobal, occurred (see also Figure S2). Otherwise, we would expect the T/G band intensities to decrease with the number of acquisitions, even with off-resonance excitation. This reversibility also suggests that the SAMs were not being irreversibly damaged, only perturbed, during the PT process. This is further supported by Figure 3e, which shows an extended SERS spectrum of the 1-DDT-covered nanocages for both excitation wavelengths. What is apparent from these similar spectra is the relatively minor disorder induced via the PT effect for the 1-DDT SAM: no SAM desorption is evident, bands associated with the v(C-S)T at 706 cm−1 and the v(C-S)G at 632 cm−1 remain essentially unchanged, and the band intensity of the CH3 rocking mode associated with T conformations at 890 cm−1 decreases, as expected. With laser powers of 4–5 mW being focused to a level of ~4 kW/cm2, the power densities in this experiment were powerful enough to produce significant ⊗Tnano.[8,14] However, due to the continuous excitation, thermal fields of neighboring particles most likely overlapped contributing to the disorder of the SAMs. In this sense, SERS is a very provocative technique with regards to monitoring the PT effect because it is sensitive to the heat from both the nanoparticle itself and its neighbors. Separating the contribution from thermal fields of neighboring particles from our SERS measurement would require pulsed or modulated lasers and consideration of the particle concentration. We are currently investigating such modifications to the conventional Raman instrument in an effort to better quantify the PT effect of Au-based nanocages. Additionally, changing the laser power had an effect on the T/G ratios of the nanocages as seen in Figure S3, where decreasing the laser power resulted in larger T/G ratios or less heat generated.
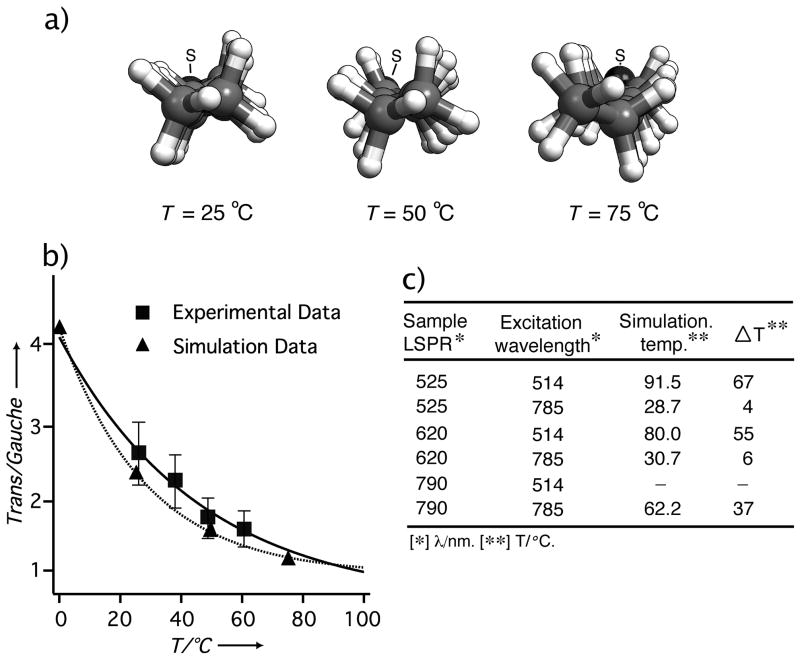
The SERS measurements could be used to quantify the temperature changes experienced by the 1-DDT SAMs on Au-Ag nanocages. In addition, a molecular dynamics (MD) simulation was also performed to act in tandem with the experimental data. Coupling the experimental and simulation data of the conformation of the 1-DDT SAMs over a range of temperatures can provide an accurate ruler to establish the temperature near a nanocage surface. Figure 4a shows the optimized alkyl chain configuration of a 1-DDT SAM on an extended Au surface at different temperatures. At higher temperatures the planar nature and the all-trans configuration was perturbed and gauche v(C-C) conformations were formed. This trend is exactly what our SERS experiments have revealed. In Figure 4b, we plot together the experimentally and theoretically derived T/G ratios, confirming the cogency of the experimentally determined T/G-temperature relationship. Both simulation and experimental data are consistent with current understanding of SAM decoupling and concomitant disordering.[19,20]
Figure 4.
(a) Optimized alkyl chain conformation of a 1-DDT SAM on an extended Au surface at three different temperatures as revealed by molecular dynamic (MD) simulations. The cartoons are looking down the chain toward the sulfur group where grey, white, and black colors represent carbon, hydrogen, and sulfur (also labeled S), respectively. When the temperature was increased, the torsion of the alkyl chains increased and there was a higher population of end-gauche and gauche conformations as evidenced by the increasing non-planar character of the alkanethiolate molecule. (b) A plot of the trans/gauche ratios of the 1-DDT SAM from experimental (square markers) and MD simulation (triangular markers) data. (c) Temperatures of the 1-DDT SAMs on the surface of nanocages derived from the MD simulations for different excitation wavelengths and LSPR peak positions and the corresponding increase in surface temperature (ΔT) obtained from SERS data.
Figure 4c shows the relationship between the temperature of the 1-DDT SAMs, the LSPR of the nanocages and the excitation wavelength. For clarity the change in temperature (⊗T) during excitation from the ambient temperature is also shown. Off-resonance excitation resulted in a small ⊗T, approximately 5 °C, for nanocages with LSPR peaks at 525 and 620 nm. As excitation moves close to the LSPR, a significant increase in temperature was measured, with ⊗T values of 67, 55, and 37 °C for nanocages with LSPR peaks at 525, 620 and 790 nm, respectively. It is interesting to note the decrease in magnitude for ⊗T is consistent with the increase of Au in the nanocages. This result supports previous reports with Au and Ag nanoparticles that found Ag nanoparticles could release more heat in comparison with Au nanoparticles when excited at plasmon frequencies, presumably due to a stronger plasmon resonance.[3,21]
The temperatures reported here are comparable with those generated by cw irradiation of Au nanoshells,[22] Au nanorods,[23] and, as expected,[7] significantly larger than the values from small Au nanoparticles.[24] This simple method to glean information about the temperature change at a nanoparticle’s surface can be extended to almost any type of nanoparticle, and also provides additional information relating to excitation dependencies and PT heating, where for large nanoparticles, some gaps between theory and experiment exist.[25] In the long run, SERS is expected to grow continuously in terms of its applicability and established synergistic relationship with various plasmon-associated phenomena. We hope this study provides insight and stimulus for more investigation between SERS and the PT effect for both fundamental understanding and practical use.
Experimental Section
The Ag nanocubes and Au-Ag nanocages were synthesized according to our previously reported procedures.[26] All samples were characterized by scanning electron microscopy (SEM, Nova NanoSEM 230), transmission electron microscopy (TEM, Tenai G2 Spirit Twin), and energy-dispersive X-ray spectroscopy (EDX).
Functionalization with 1-dodecanethiol (1-DDT, Aldrich) was performed by suspending the Ag nanocubes or Au-Ag nanocages in a 1 mM solution of 1-DDT in ethanol for 24 h, followed by centrifugation and removal of the supernatant and re-disperal in water. The 1-DDT functionalized particles were stable for several weeks before settling out of solution. The SERS spectra were recorded from solution phase using a Renishaw inVia confocal Raman spectrometer coupled to a Leica microscope.
Molecular dynamics (MD) calculations were performed using the Forcite module of Materials Studio (Accelrys Inc.). We chose a unit cell of 100 alkanethiolates on a Au(100) surface with periodic boundary conditions and lattice constants of a=288.4 Å, b=288.4 Å, and c=22.0 Å. The simulations were conducted with the NVT ensemble using the Forcite dynamic calculation scheme to calculate the optimized structures of the alkanethiolate molecules at 0, 25, 50, and 75°C. See Supporting Information for more details.
Footnotes
This work was supported in part by a 2006 Director’s Pioneer Award from the NIH (DP1 OD000798–05), a research grant from the NSF (DMR-0804088), and start-up funds from Washington University in St. Louis.
References
- 1.a) Jeanmaire DL, Van Duyne RP. J Electroanal Chem. 1977;84:1. [Google Scholar]; b) Moskovits M. J Raman Spectrosc. 2005;36:485. [Google Scholar]
- 2.a) Nie S, Emory SR. Science. 1997;275:1102. doi: 10.1126/science.275.5303.1102. [DOI] [PubMed] [Google Scholar]; b) Kneipp K, Wang Y, Kneipp H, Perelman LT, Itzkan I, Dasari RR, Feld MS. Phys Rev Lett. 1997;78:1667. doi: 10.1103/PhysRevLett.76.2444. [DOI] [PubMed] [Google Scholar]
- 3.Govorov AO, Richardson HH. Nano Today. 2007;2:30. [Google Scholar]
- 4.a) Alper J, Crespo M, Hamad-Schifferli K. J Phys Chem C. 2009;113:5967. [Google Scholar]; b) Bakhtiari AB, Hsiao D, Jin G, Gates BD, Branda NR. Angew Chem Int Ed. 2009;48:4166. doi: 10.1002/anie.200805303. [DOI] [PubMed] [Google Scholar]
- 5.Pissuwan D, Valenzuela S, Cortie M. Trends in Biotechnol. 2006;4:62. doi: 10.1016/j.tibtech.2005.12.004. [DOI] [PubMed] [Google Scholar]
- 6.Cortie M, Harris N, Ford M. Phys B. 2007;394:188. [Google Scholar]
- 7.Akchurin G, Khlebtsov B, Akchurin G, Tuchin V, Zharov V, Khlebtsov N. Nanotechnology. 2008;19:015701. doi: 10.1088/0957-4484/19/01/015701. [DOI] [PubMed] [Google Scholar]
- 8.Richardson HH, Hickman ZN, Govorov AO, Thomas AC, Zhang W, Kordesch ME. Nano Lett. 2006;6:783. doi: 10.1021/nl060105l. [DOI] [PubMed] [Google Scholar]
- 9.Jain PK, Lee KS, El-Sayed IH, El-Sayed MA. J Phys Chem B. 2006;110:7238. doi: 10.1021/jp057170o. [DOI] [PubMed] [Google Scholar]
- 10.Hartland GV. Phys Chem Chem Phys. 2004;6:5263. [Google Scholar]
- 11.Au L, Zheng D, Zhou F, Li ZY, Li X, Xia Y. ACS Nano. 2008;2:1645. doi: 10.1021/nn800370j. [DOI] [PMC free article] [PubMed] [Google Scholar]
- 12.Yavuz MS, Cheng Y, Chen J, Cobley CM, Zhang Q, Rycenga M, Xie J, Kim C, Song K, Schwartz AG, Wang LV, Xia Y. Nat Mater. 2009 doi: 10.1038/nmat2564. in press. [DOI] [PMC free article] [PubMed] [Google Scholar]
- 13.Song KH, Kim C, Cobley CM, Xia Y, Wang LV. Nano Lett. 2009;9:183. doi: 10.1021/nl802746w. [DOI] [PMC free article] [PubMed] [Google Scholar]
- 14.Keblinski P, Cahill DG, Bodapati A, Sullivan CR, Taton TA. J Appl Phys. 2006;100:054305. [Google Scholar]
- 15.Wang Z, Carter JA, Lagutchev A, Koh YK, Seong NH, Cahill DG, Dlott DD. Science. 2007;317:787. doi: 10.1126/science.1145220. [DOI] [PubMed] [Google Scholar]
- 16.Rycenga M, McLellan JM, Xia Y. Chem Phys Lett. 2008;463:166. doi: 10.1016/j.cplett.2008.08.062. [DOI] [PMC free article] [PubMed] [Google Scholar]
- 17.a) Bryant MA, Pemberton JE. J Am Chem Soc. 1991;113:3629. [Google Scholar]; b) Bryant MA, Pemberton JE. J Am Chem Soc. 1991;113:8284. [Google Scholar]
- 18.Rycenga M, Hou KK, Cobley CM, Schwartz A, Camargo PHC, Xia Y. Phys Chem Chem Phys. 2009;11:5903. doi: 10.1039/b903533h. [DOI] [PubMed] [Google Scholar]
- 19.Vemparala S, Karki BB, Kalia RK, Nakano A, Vashishta P. J Chem Phys. 2004;121:4323. doi: 10.1063/1.1775779. [DOI] [PubMed] [Google Scholar]
- 20.Mar W, Klein ML. Langmuir. 1994;10:188. [Google Scholar]
- 21.Lee KS, El-Sayed MA. J Phys Chem B. 2006;110:19220. doi: 10.1021/jp062536y. [DOI] [PubMed] [Google Scholar]
- 22.Hirsch LR, Stafford RJ, Bankson JA, Sershen SR, Rivera B, Price RE, Hazle JD, Halas NJ, West JL. Proc Natl Acad Sci. 2003;100:13549. doi: 10.1073/pnas.2232479100. [DOI] [PMC free article] [PubMed] [Google Scholar]
- 23.Chou CH, Chen CD, Wang CRC. J Phys Chem B. 2005;109:11135. doi: 10.1021/jp0444520. [DOI] [PubMed] [Google Scholar]
- 24.Richardson HH, Carlson MT, Tandler PJ, Hernandez P, Govorov AO. Nano Lett. 2009;9:1139. doi: 10.1021/nl8036905. [DOI] [PMC free article] [PubMed] [Google Scholar]
- 25.Hleb EY, Lapotko DO. Nanotechnology. 2008;19:355702. doi: 10.1088/0957-4484/19/35/355702. [DOI] [PubMed] [Google Scholar]
- 26.Skrabalak SE, Au L, Li X, Xia Y. Nat Protoc. 2007;2:2182. doi: 10.1038/nprot.2007.326. [DOI] [PubMed] [Google Scholar]


