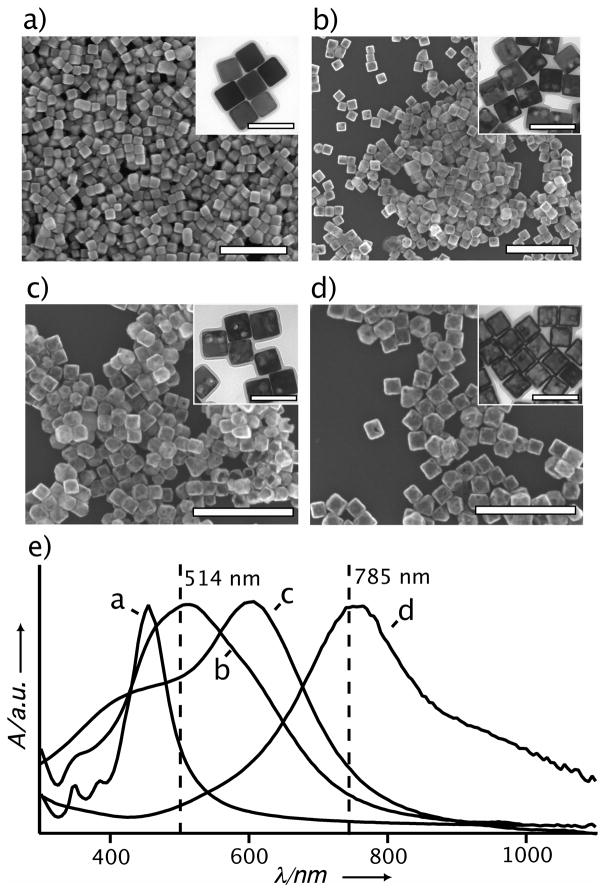
Figure 1.
SEM and TEM images of the (a) Ag nanocubes and (b–d) Au-Ag nanocages used in this study. The scale bars are 500 nm and 100 nm for the SEM and TEM (inset) images, respectively. (e) Absorbance spectra taken from the Ag nanocubes and Au-Ag nanocages. The Au-Ag nanocages were prepared from the Ag nanocubes in (a) via the galvanic replacement reaction and the LSPR peak was tuned to (b) 525 nm, (c) 620 nm, and (d) 790 nm. The vertical lines in (e) correspond to the wavelengths of the excitation sources used for SERS. The well-defined LSPR peaks indicate that the particles were well dispersed in the solution phase although they may aggregate upon drying (as seen in the SEM images) due to the capillary force.

