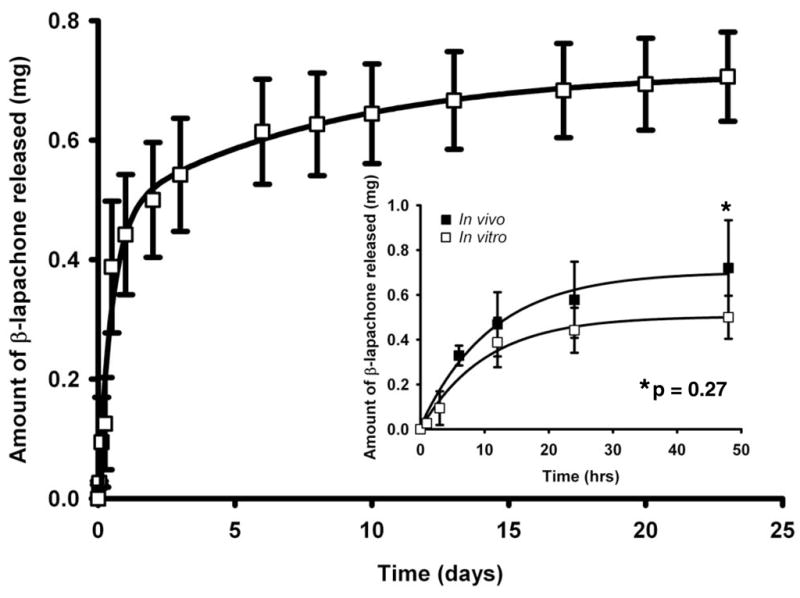
Fig. 3.

Cumulative levels of β-lap released from PLGA millirods were plotted as a function of time (h). The figure inset depicts cumulative β-lap released in vitro compared to in vivo following millirod implantation into PC-3 tumor xenografts within 48 h. Release levels were calculated as the differences between initial amount of β-lap loaded and amount remaining in millirods over time. Values are means ± SEM (n=3).
