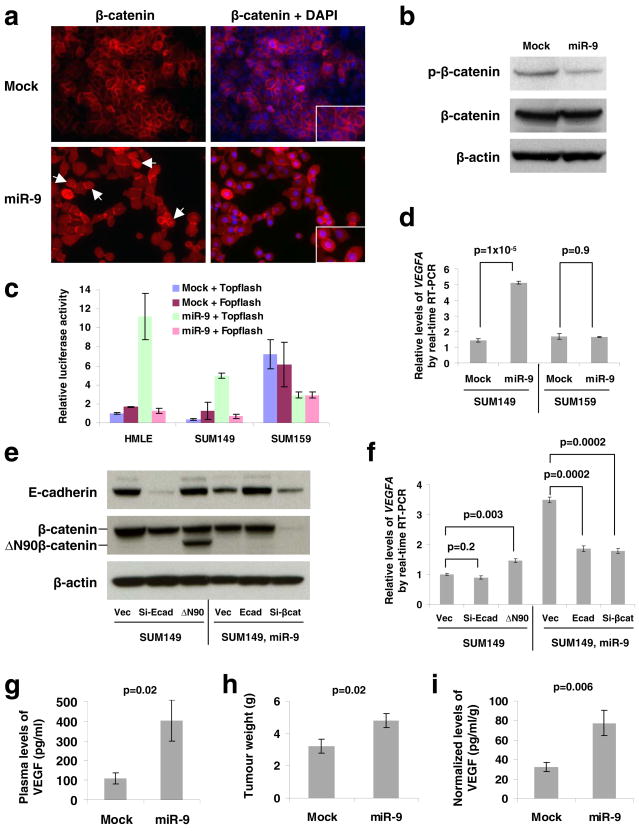
Figure 2. miR-9 increases VEGF levels in an E-cadherin- and β-catenin-dependent manner.
(a) Immunofluorescence staining of β-catenin (red) in mock-infected or miR-9-expressing SUM149 cells demonstrates differential localization. Right panels are the overlay of β-catenin and nuclear 4′,6-diamidino-2-phenylindole (DAPI; blue) staining of the same field. White arrows indicate cells positive for nuclear β-catenin. Insets: blow-up images of particular cells. Magnification: x200.
(b) Immunoblotting of phospho-β-catenin (Ser33/37/Thr41, GSK-3β phosphorylation sites) and β-catenin in SUM149 cells infected with the miR-9-expressing or empty vector.
(c) Topflash reporter assay in HMLE, SUM149, and SUM159 cells infected with the miR-9-expressing or empty vector.
(d) Real-time RT-PCR of total VEGFA mRNA in SUM149 and SUM159 cells infected with the miR-9-expressing or empty vector.
(e) Immunoblotting of E-cadherin and β-catenin in SUM149 cells infected with E-cadherin siRNA (si-Ecad) or ΔN90β-catenin (ΔN90), and in SUM149-miR-9 cells infected with E-cadherin (Ecad) or β-catenin siRNA (si-βcat). Vec: the pLKO-puro vector with a scrambled sequence that does not target any mRNA.
(f) Real-time RT-PCR of total VEGFA mRNA in the same cells described in e. A representative experiment is shown in triplicate along with s.e.m. in c, d and f.
(g–i) Plasma levels of VEGF (g), primary tumor weight (h), and normalized VEGF levels (i) in mice that received orthotopic injection of miR-9-transduced or mock-infected SUM149 cells, at week 12 after transplantation. Data are presented as mean ± s.e.m. (n = 8 mice per group).

