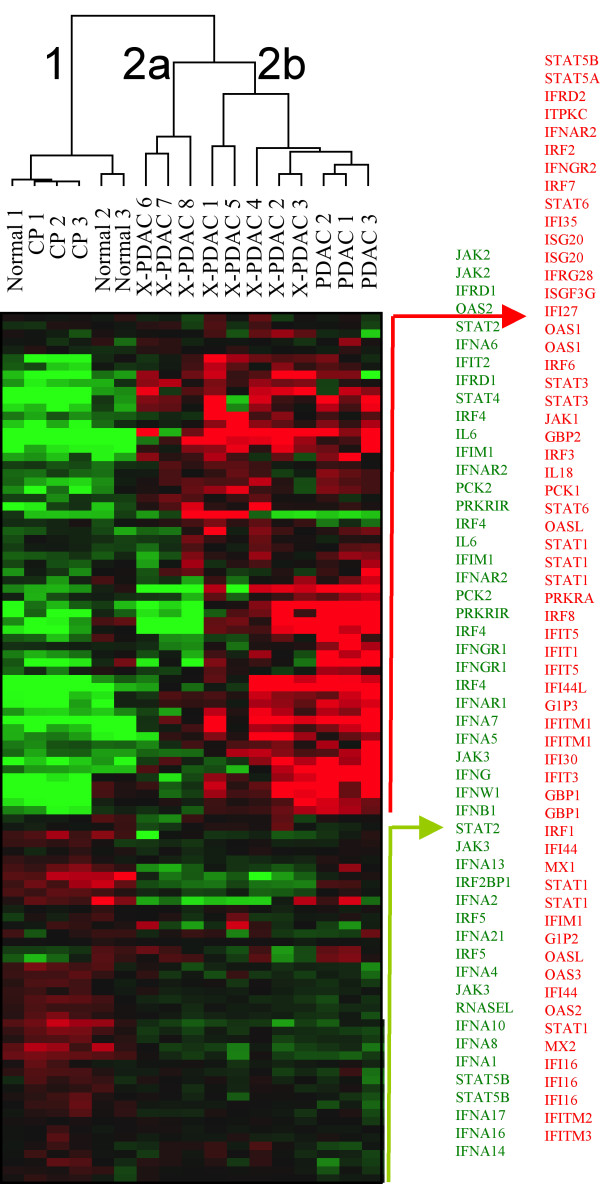
Figure 1.
Interferon related genes expression profile. Supervised cluster expression analysis of 76 selected interferon related genes, represented by 112 probesets, in 8 xenografted primary pancreatic adenocarcinomas (X-PDAC), 3 pancreatic adenocarcinoma bulk tissues (PDAC), 3 chronic pancreatitis (CP) and 3 normal pancreas (Normal). The analysis distinguished a cluster comprising the 11 adenocarcinoma samples (cluster 2) from the normal and pancreatitis samples that clustered together (cluster 1). Among the cancer samples there were two phenotypes, 2a and 2b, the former being closer to the cluster of normal and pancreatitis. The list of probesets corresponding to up regulated genes in group 2b is listed in red while those corresponding to down regulated genes are in green.

