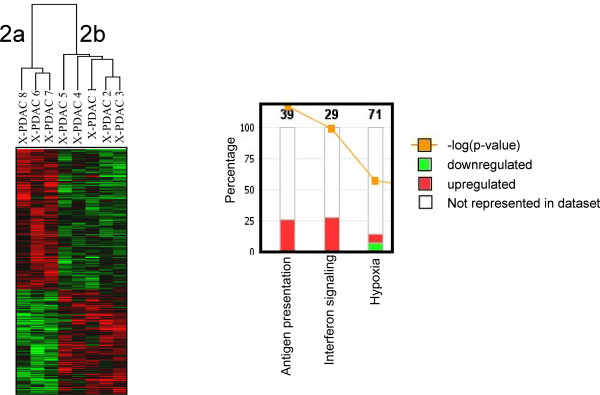
Figure 2.
Genes differentially expressed between clusters 2a and 2b xenografts. Left panel, cluster analysis of 1,203 differentially expressed genes between the clusters 2a and 2b of Figure 1 (red indicates up-regulation while green down-regulation). Right panel, canonical pathway analysis of the 1,203 genes using the Ingenuity Pathway Analysis software. The 3 most significantly modulated pathways are indicated; the stacked bars represent the proportion of differentially expressed genes over the total number of genes involved in the specific pathway (number on top of the bars).

