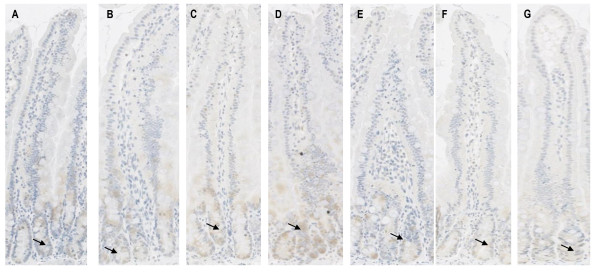
Figure 3.
Protein expression of TNF in the jejunum following six weeks of fractionated radiotherapy. A = control; B = 7.5 Gy; C = 15 Gy; D = 22.5 Gy; E = 30 Gy; F = 37.5 Gy G = 45 Gy. There was no change in the level of expression at any time point. Staining was only observed in the crypts, as indicated by the arrows. There was no staining seen in the villi.

