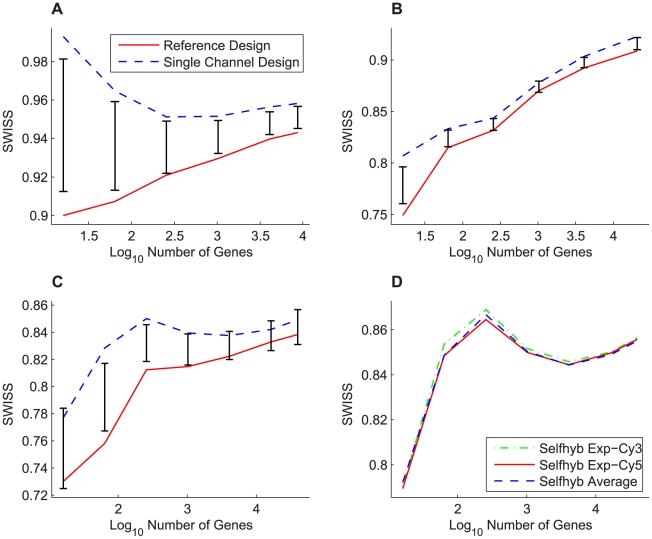
Figure 4. Effect of filtering genes by variance, datasets I–IV.
SWISS scores for the reference design (solid red) and single channel design (dashed blue) along with corresponding 90% confidence intervals (black bars) calculated from the SWISS permutation test are shown for datasets I – III (A – C). The SWISS scores for the self-self hybridization Exp-Cy3 channel (dot-dashed green), Exp-Cy5 channel (solid red), and the average of the two self-self hybridization channels (dashed blue) are shown for dataset IV (D). In A (dataset I), the reference design is always significantly better than the single channel design (because the black bars are always inside the blue and red curves). However, in B and C (datasets II and III), there are certain gene sets where there is a significant difference between the two designs and other gene sets where there is no significant difference. In D, there is very little difference between each of the two experimental channels and the average of the two channels.

