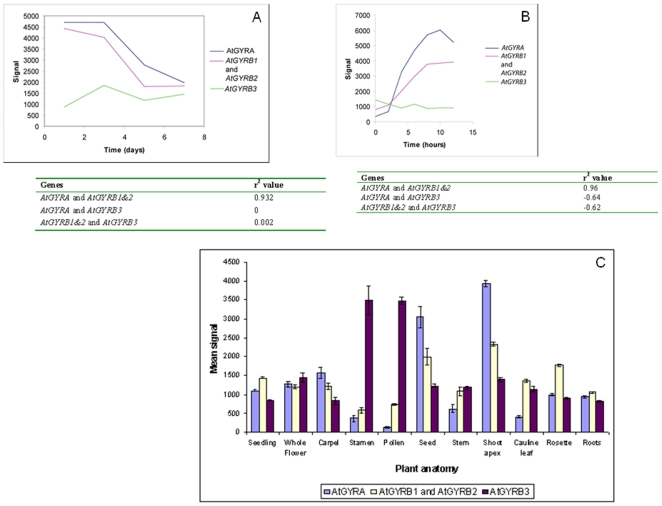
Figure 2. Gene expression analysis.
A: Gene expression in Arabidopsis cell culture following sub-culture into fresh media [27]. Day 1 = late lag/early exponential phase; day 3 = mid-exponential phase; day 5 = transition from exponential phase to stationary phase; day 7 = stationary phase. Pearson's correlation coefficients are given in the table; where r2 = 1 is a positive correlation and r2 = 0 is no correlation. B: Gene expression in an Arabidopsis cell culture after synchrony in G1 phase [27]. G1 phase = 0 to 6 h; S phase = 6 to 11 h; G2 = 11 to 12 h. Correlation coefficients are given in the table. C: Expression of GYRA, GYRB1, GYRB2 and GYRB3 in different parts of the Arabidopsis plant [26]. GYRB3 is most strongly expressed in the stamens and pollen, whereas GYRA, GYRB1 and GYRB2 are most strongly expressed in the seed and shoot apex.

