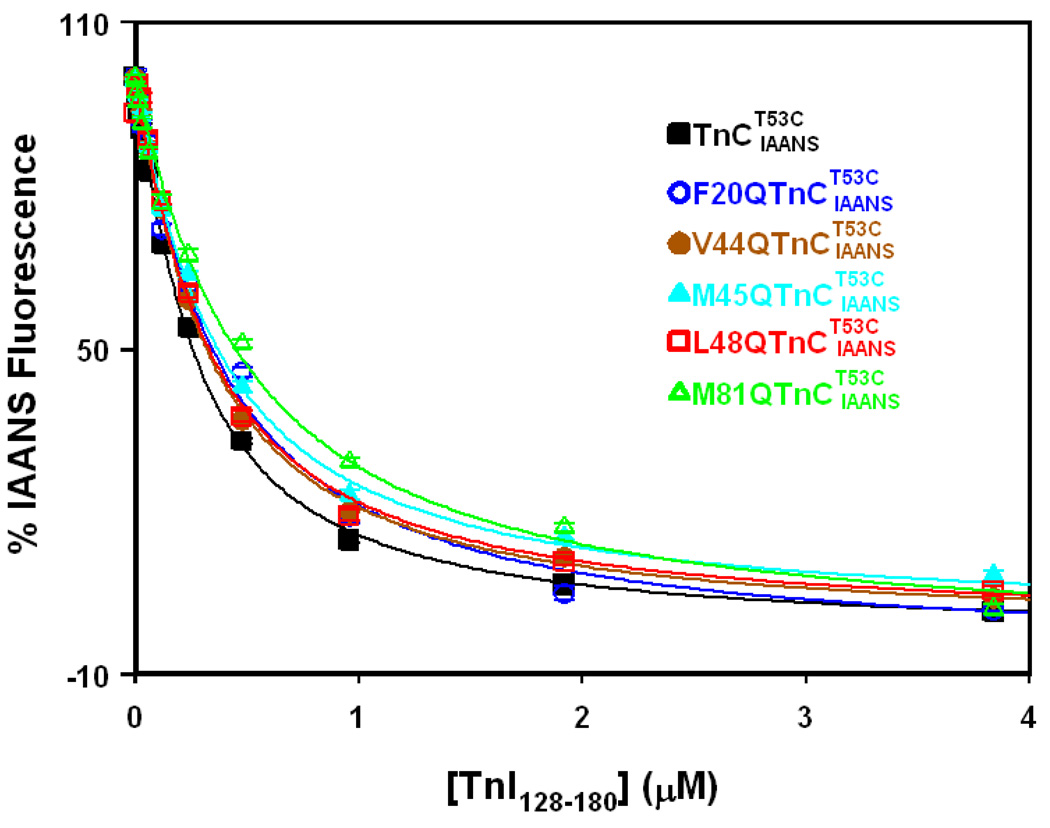
Figure 3. Effect of TnC mutations on TnI128–180 binding affinity of TnC.
Figure shows the effect of TnC mutations on the TnI128–180 binding properties of the Ca2+ saturated TnC. The concentration of TnC or its mutants was at 0.15 µM. The TnI128–180 dependent changes in IAANS fluorescence are shown as a function of [TnI128–180] for Ca2+ saturated (black ■), (blue ○), (brown ●), (cyan ▲), (red □) and (green △). 100% IAANS fluorescence corresponds to the Ca2+ -saturated state, whereas 0% corresponds to the Ca2+-InI128–180 saturated state for each individual TnC protein. In the case of , the IAANS fluorescence increased upon addition of TnI128–180, so the plot of the data was inverted for comparison purposes. Each data point represents the mean ± S.E. of three to six titrations fit to the root of quadratic equation for binary complex formation.

