
Figure 1. Modularity characterization of HGU95Av2 compendium.

(A) All pairwise covariances were calculated between 9105 genes; entries whose absolute values were greater than .25 were set to one and colored black (set to zero and colored white otherwise). (B) Binarized covariance matrix after hierarchical biclustering (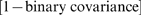 distance metric and complete linkage) to identify coordinated expression modules. The observed modularity is not due to chance, as an identical procedure applied to a randomized expression matrix showed no covariance blocks larger than a few genes (not shown).