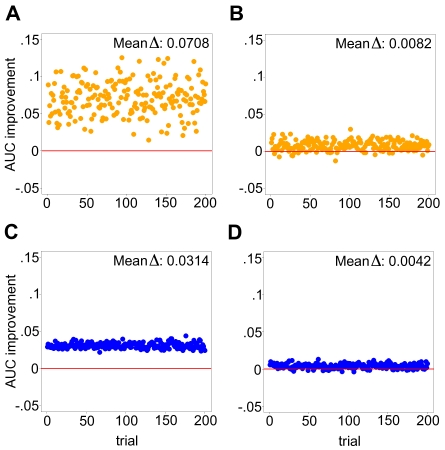
Figure 3. SAGAT performance on four simulated data-knowledge configurations.
In each panel, both SAGAT and the fold change metric were applied to 200 simulated datasets consisting of either one [(A) and (B)] or 15 replicates [(C) and (D)]; the AUC improvement achieved by SAGAT over fold change is displayed for each. In (A) and (C), a simulated knowledge compendium matching Figure 2A was used by SAGAT; in (B) and (D) the simulated knowledge corresponds to Figure 2B. On average, SAGAT outperforms fold change in all four cases with the mean improvement located at the top of each panel. The simulated knowledge structure for (B) and (D) represents a conservative approximation of the structure of a real biological dataset (see Discussion).

