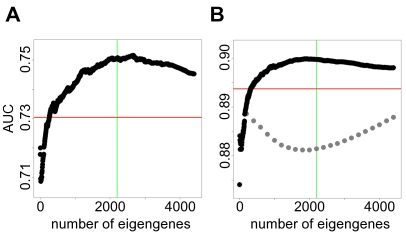
Figure 4. Identifying the optimal number of eigengenes.
(A) and (B) show SAGAT performance versus varying numbers of eigengenes (parameter M) when applied to two non-overlapping four-array subsets of the prostate cancer dataset. The HGU95Av2 knowledge compendium was used for this task. The red horizontal lines denote the performance of the fold change metric. In both cases, M set to approximately half the number of arrays in the compendium leads to the best performance; this point is marked with green vertical lines. In (B), the light gray points display SAGAT performance when using a randomized knowledge compendium; this suggests that SAGAT improvement over fold change is not due to chance.

