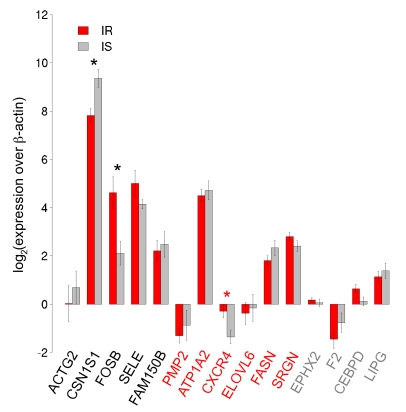
Figure 6. Quantitative PCR validation of insulin resistance candidate genes.
Fifteen genes were tested for differential expression between 11 out of the original 12 insulin resistant samples and all 12 original insulin sensitive samples using TaqMan Real-time PCR. The first five genes came from predictions of both fold change and SAGAT, the next six were suggested by SAGAT only, and the last four genes served as negative controls. The directionality of differential expression of all non-control genes was in agreement between the microarray and qPCR data. Three DE genes were statistically significant according to qPCR: CSN1S1, FOSB, and CXCR4.

