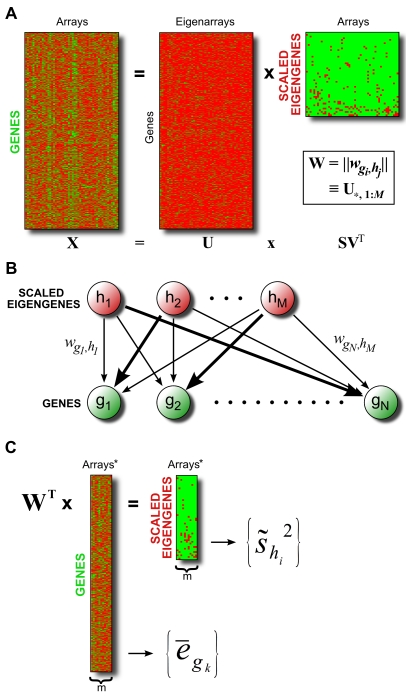
Figure 7. Overview of SAGAT method.
(A) Schematic of SVD applied to a matrix of microarray knowledge. The dimensions of matrix  are “scaled eigengenes” by arrays. The weight matrix W, consisting of the first M columns of U, is used in subsequent steps. (B) Graphical depiction of SVD model, whereby each gene's expression is a weighted combination of underlying eigengene expressions with weights given by W. (C) SAGAT transforms a dataset of interest into eigengene space by premultiplying the data matrix by the transpose of the weight matrix W. Both the original and transformed data matrices are subsequently used to calculate the SAGAT statistic (in the forms of
  and
and  , respectively).

