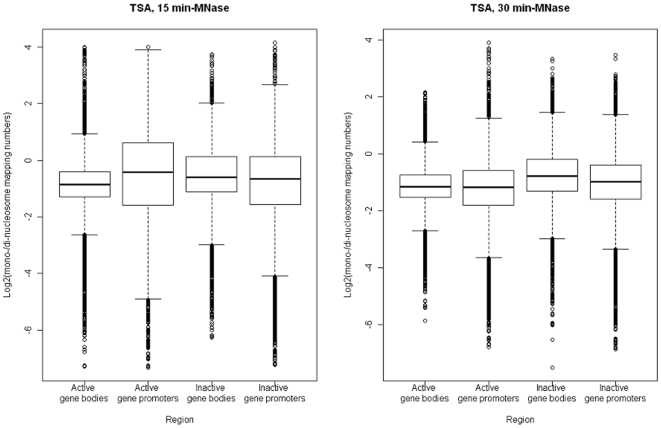
Figure 3. Boxplots of the ratios (log2 scale) of the mononucleosome mapping numbers to the dinucleosome mapping numbers for trichostatin A-treated cells of Aspergillus fumigatus in transcriptionally active and inactive gene bodies and promoters.
The boxes are composed of the medians with the first and third quartiles. The dots indicate outliers.

