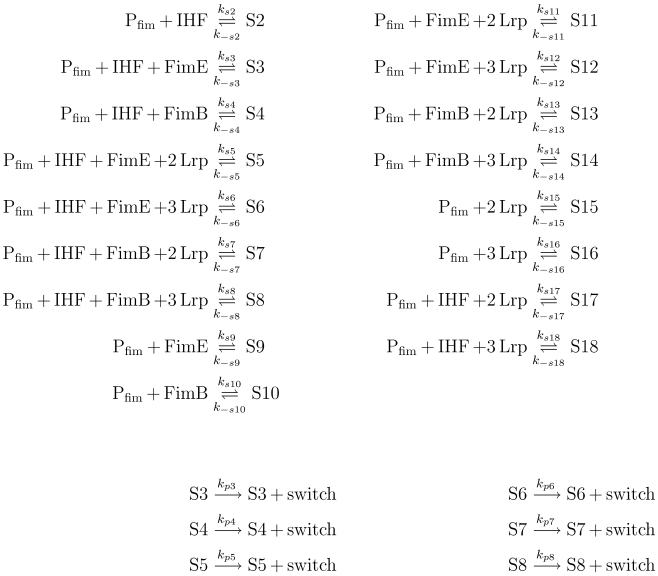
Figure 4. Detailed fim switch configuration model.
Here,  abstracts the free form of the regulatory protein binding sites in fimS. Complex species
  through
  represent the various states of the fimS DNA element given in Table 6. An abstracted species, switch, captures the switching events.

