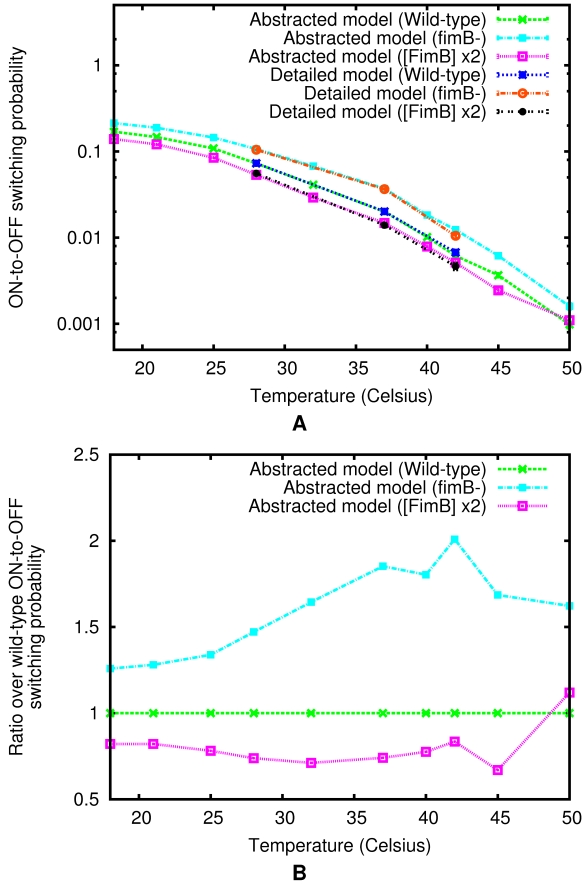
Figure 8. Role of FimB in the temperature control mechanism of the total ON-to-OFF fim switching probability.
The total ON-to-OFF switching probability of two in silico generated mutants: one—overproducing  (at twice the wild-type level), and the other—a
  knockout (no ON-to-OFF
  activity). These are compared with the wild-type system behavior using their respective abstracted models at the same 10 temperature points (see Figure 7A). Here, (A) The total ON-to-OFF switching probability per cell per generation in minimal medium is plotted versus temperature. For numerical comparison, each case also includes three points computed directly via the detailed model. (Error bars indicate 95% confidence interval); and (B) The ratio of the total ON-to-OFF switching probability in each of the mutants to the total ON-to-OFF switching probability of the wild-type is plotted versus temperature.

