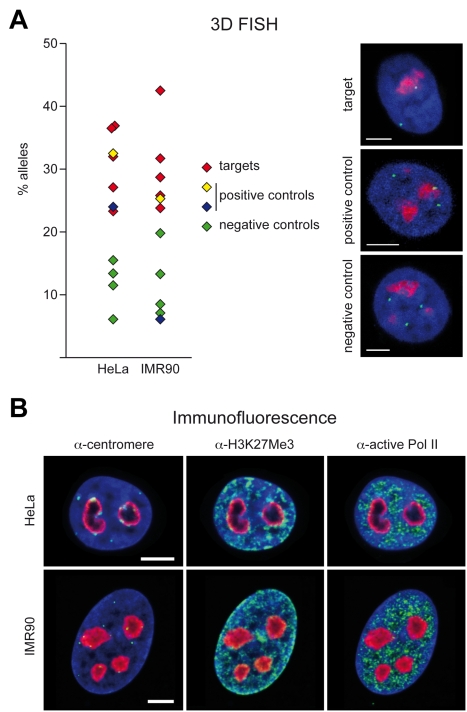
Figure 4. 3D immuno–FISH analysis of nucleolus-associated chromatin domains.
(A) Histograms show the frequency of the nucleolar localisation of NADs and control chromosomal regions detected by 3D FISH in HeLa cervix carcinoma and IMR90 diploid fibroblast cells. Percentage of nucleolus-associated alleles is shown on the left. Red diamond indicates target, green ones negative controls, whereas yellow diamond indicates the chromosome X pericentromeric and blue diamond the 5S cluster positive controls, respectively (see Table S7 for further BAC details). Single light optical sections of HeLa nuclei are shown on the right. BAC hybridization signals of RP11-90G23 target, RP5-915N17 positive control and RP11-81M8 negative control BACs are shown in green, nucleolar staining in red and DAPI counterstain in blue (scale bars: 5 µm). (B) α-H3K27Me3, α-centromere, α-active Pol II and α-B23/nucleophosmin immunostaining of HeLa and IMR90 cells. α-H3K27Me3, α-centromere and α-active Pol II signals are shown in green, nucleolar staining in red and DAPI counterstain in blue (scale bars: 5 µm).

