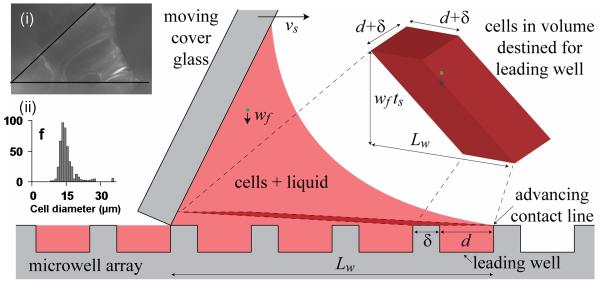
Figure 5.
Schematic of fluid flow and cell seeding during the wiping process. The moving cover glass spreads a wedge of fluid over the microwell array, forcing the leading contact line to advance and draw fluid with cells into empty wells ahead of the wedge. Cells also fall toward the wells and are also pushed and scraped into the wells. The cells destined for the leading well are located in a 3D parallelogram near the array. The height of the slice is exaggerated for clarity. Inset (i) shows actual fluid wedge between the cover glass and the microwell array. Inset (ii) shows the histogram of cell and cell aggregate diameters. The notation is as follows: vs is the wiping speed of the cover glass, d and δ are the microwell diameter and spacing, ts is the time over which the cover glass travels the base length Lw of the fluid wedge (~6 microwells), wf is the terminal fall velocity of the cells (~10 μm/s).

