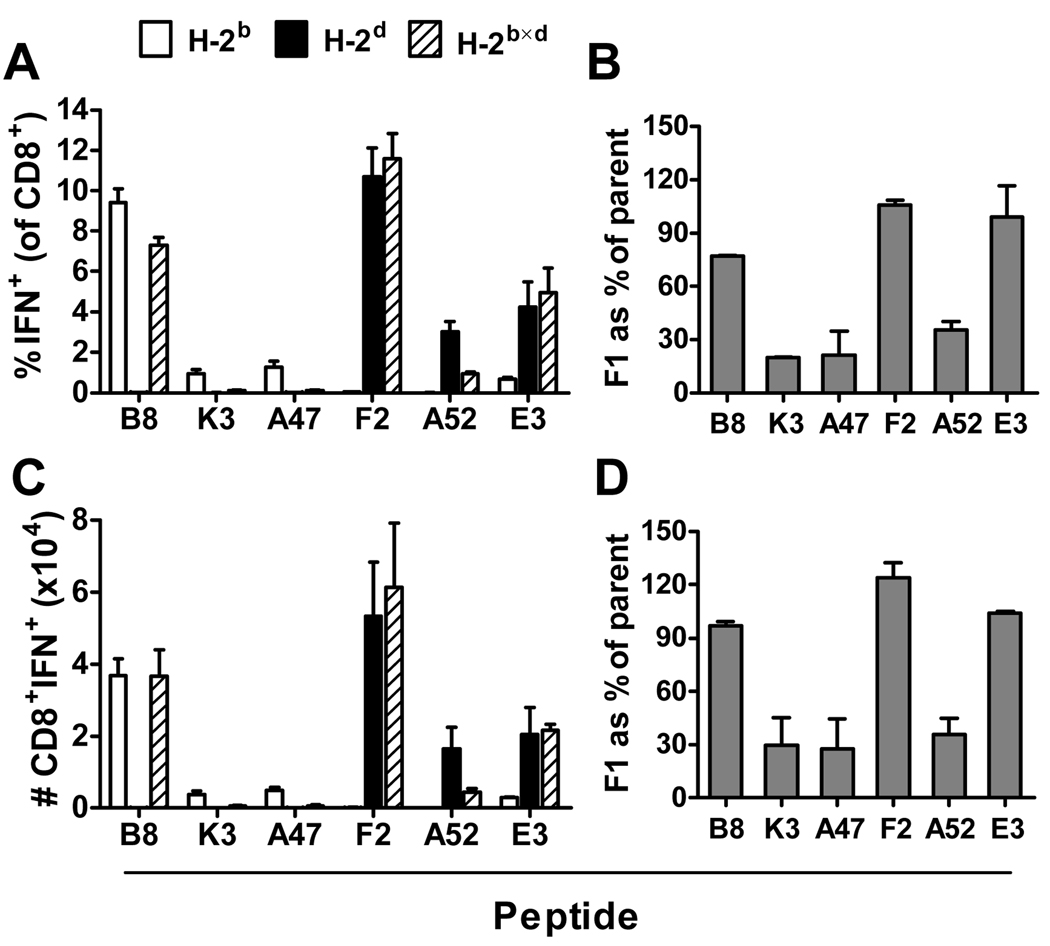
Figure 3. Peptide-specific CD8+ T cell responses to VACV at the peak of the acute response in MHC congenic mice and their F1 progeny.
Groups of C57Bl/10 (H-2b), C57Bl/10.D2 (H-2d) or B10×D2F1 (H-2b×d) mice were infected i.p. with 106 pfu VACV strain WR. Seven days later CD8+ T cell responses in the spleen were measured by ICS. Percentages (A) and total numbers (C) of CD8+ T cells that produce IFN-γ in ex vivo stimulations with the indicated peptides from one representative experiment; data are means and SEM of groups of 4 mice. The ratios of responses in F1 mice compared with parent strains are shown based on percentages (B) and total numbers (D); data are means and SEM of 2 experiments.

