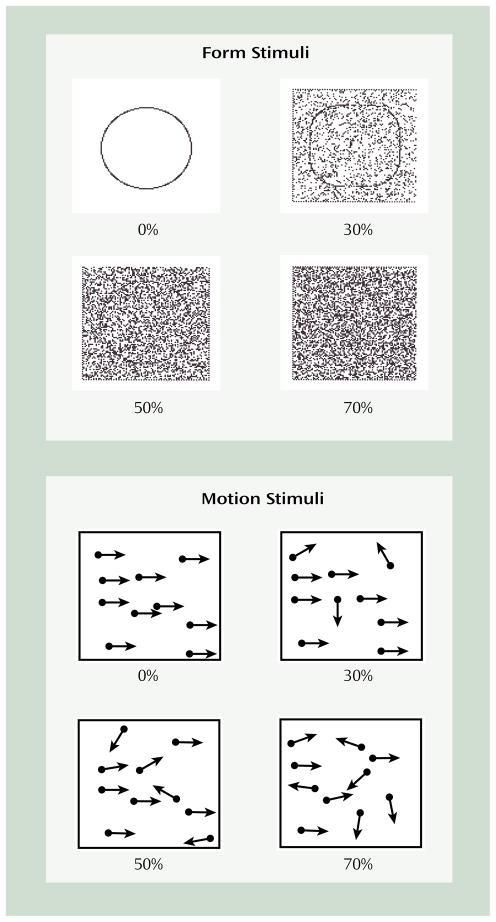
FIGURE 1. Illustrations of Form and Motion Stimuli Used in Form and Trajectory Processing Tests at Different Levels of Noisea.
aFor the form tests, either a circle or a square with rounded corners was presented on each trial. The percentages indicate the proportion of pixels that were randomly assigned a value of black or white in the stimulus region. For the motion tests, a set of moving dots was plotted on the screen. The arrows represent the trajectory of each dot at different levels of noise. The percentages indicate the proportion of dots in the array that are moving randomly. For both tests, the percentage of noise was increased until the subject could no longer reliably identify the stimulus, which indicated the subject’s performance threshold.

