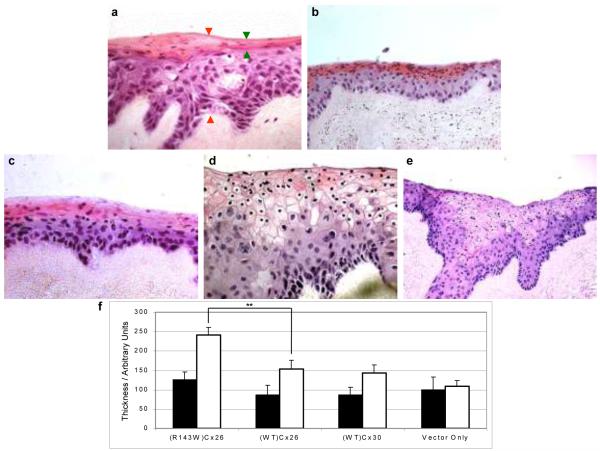
Figure 2.
Histological features of organotypic co-cultures. Haematoxylin and eosin stained sections of a) pSIN-GFP (vector-only); b) (WT)Cx30; c) (WT)Cx26; d) (R143W)Cx26 co-cultures at 400 × magnification and e) (R143W)Cx26 at 200 × magnification. Green and orange arrows shown on a) represent the distance at which the eosin-positive layer and full thickness of the epidermal equivalent were measured, respectively. f) Graph representing the average thickness of the eosin-positive layer (black bars) and average full thickness of the epidermal equivalent (white bars). Unpaired, two-tailed t-test showed that the total thickness of the epidermal equivalent of the (R143W)Cx26 co-culture was statistically different from (WT)Cx26 (** represents p < 0.01). Error bars represent the standard error of the mean (SEM), n= 3.

