
Figure 4.
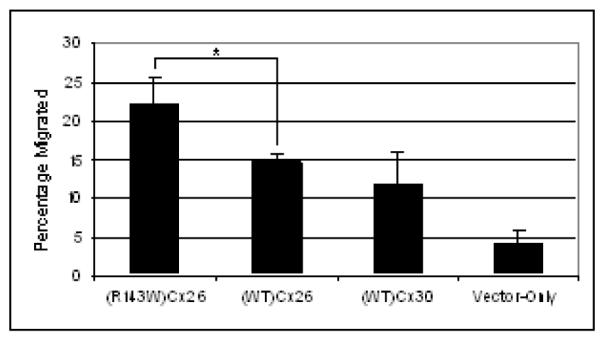
Keratinocyte cellular migration analysis. A monolayer of NTERTS overexpressing (R143W)Cx26, (WT)Cx26, (WT)Cx30, or vector-only control were scratched. Graph shows the percentage of cells migrated after 48 hours. The data represent mean ± the standard error of the mean (SEM). Comparison was carried out using unpaired, one tailed t-test where a significant difference was found between (WT)Cx26 and (R143W)Cx26. * represents p ≤ 0.05.