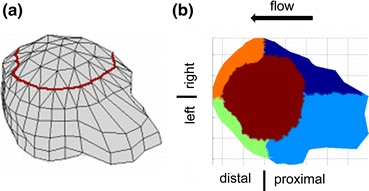
Figure 1.

(a) A 3-D reconstruction of a cell where red line delineates the top region of the cell. (b) The cell surface is divided into 5 regions, shown in different colors, for the analysis of cell morphological changes as a response to a steady laminar flow
