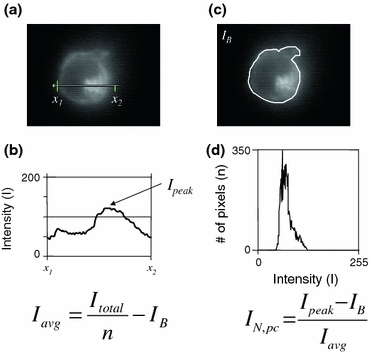
Figure 2.

Methods for measurement of fluorescence intensities on single cells. (a, b) Line intensity profile across the perinuclear region of the cell to determine the peak intensity (I peak) within the cell cytoplasm. (c, d) Fluorescence intensity histogram over the cell cross-section. The average intensity in the cell (I avg) is determined by dividing the total intensity (I total) by the total number of pixels within the cell contour (n) and subtracting the background intensity (I B), while the normalized intensity of the perinuclear compartment (I N,pc) is calculated according to the expression on the right
