
Fig. 4.
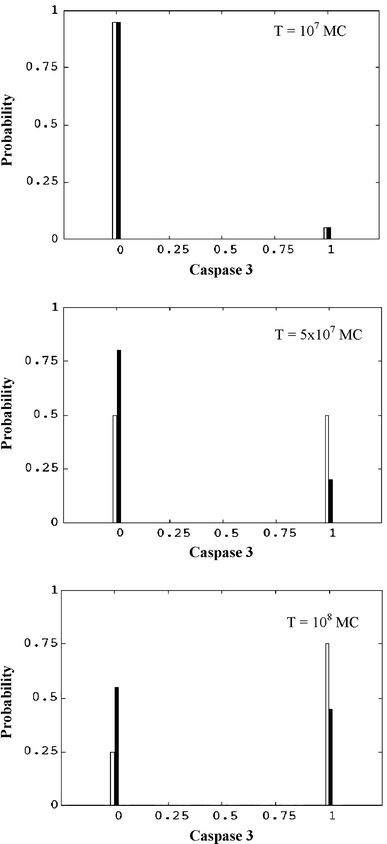
Probability distribution of caspase 3 calculated from single cell activation data of caspase 3. We show results for two neuroglobin concentrations: neuroglobin = 0 (white bars) and neuroglobin = 0.01 μM (black bars). Cytochrome c concentration is fixed at 0.1 μM. Caspase 3 concentration (x-axis) is normalized by the maximum. Time is measured in monte carlo (MC) simulations steps. 1 MC step = 10−4 s