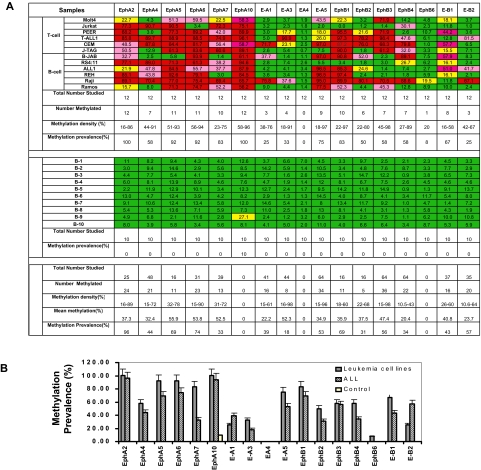
Figure 1.
Validation of methylation status of Eph/ephrin family genes in leukemia cell lines, primary ALL samples, and normal controls. (A) Methylation profile of Eph receptor/ephrin genes in leukemia cell lines and normal controls. Bisulfite pyrosequencing was performed to determine methylation status. Green indicates methylation density < 15%; yellow, methylation density between 15% and 29.99%; pink, methylation density between 30% and 59.99%; and red, methylation density > 60%. Methylation density > 15% was used to define a sample as methylated. (B) Methylation prevalence of 17 Eph/ephrin family genes in leukemia cell lines, ALL patients, and normal CD19+ controls. Methylation density > 15% was used as the cutoff for hypermethylation. Methylation prevalence was calculated as the percentage of positive methylated samples vs the total numbers studied for each gene. Error bars indicate range.

