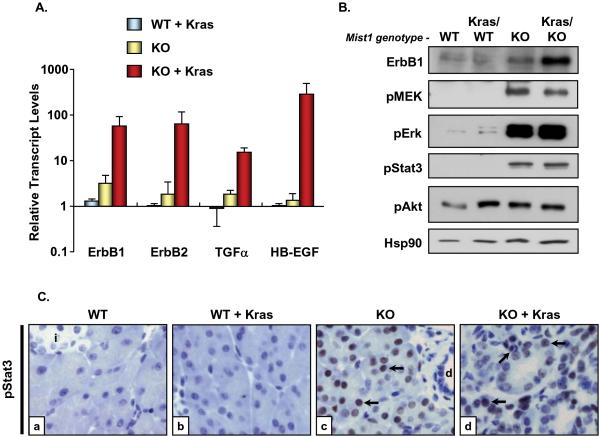
Figure 5. Mist1LacZ/LacZ and Mist1LacZ/LacZ/LSL-KrasG12D/+/ptf1aCre/+ pancreata exhibit elevated levels of EGFR signaling components and activation of downstream signaling pathways.
(A) Quantitative RT-PCR to detect ErbB1, ErbB2, TGFα, and HB-EGF transcript levels from the indicated pancreata samples. All values were normalized to Mist1+/+ (WT) samples which were set to 1.0. (B) Immunoblots for a number of EGFR signaling components. In all cases, Mist1LacZ/LacZ (KO) and Mist1LacZ/LacZ/LSL-KrasG12D/+/ptf1aCre/+ (KO + Kras) samples exhibited activation of the downstream pathways, with the exception of pAKT, which did not significantly change with different genotypes. Hsp90 was used as a loading control. (C) Immunohistochemistry with anti-pStat3 reveals that acinar cells in the Mist1KO background are pStat3 positive (arrows). Duct (d) and islet (i) cells remain pStat3 negative, as do acinar cells in a Mist1WT background (x800).

