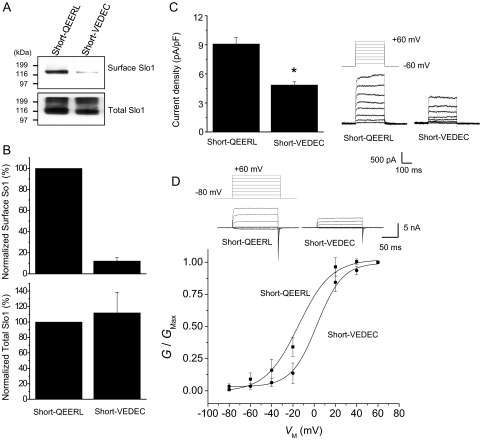
Fig. 4.
Short-VEDEC has lower steady-state surface expression than Short-QEERL. A, representative cell-surface biotinylation assays performed in HEK293T cells heterologously expressing Short-QEERL or Short-VEDEC, as indicated. Top, cell surface Slo1; bottom, expression of total Slo1. Signals were obtained by immunoblot analysis using antibodies against the Myc tags. B, summary of densitometric analysis of surface and total expression of Slo1 presented as mean ± S.E.M. from three repetitions of the experiment shown in A. Top, normalized surface Slo1; bottom, total expression of Slo1. C, representative traces of families of currents obtained by whole-cell recording from HEK293T cells expressing Short-QEERL or Short-VEDEC are shown to the right of a bar graph summarizing mean ± S.E.M. of whole-cell current densities evoked by step pulses to +60 mV (n = 34 cells). ∗, P < 0.05. D, voltage-dependence of activation determined in inside-out patches from HEK293T cells expressing Short-QEERL or Short-VEDEC. Recordings were made in symmetrical 140 mM KCl, and bath solutions contained 10 μM free Ca2+. Representative traces are shown above voltage activation curves. Data points are mean ± S.E.M. (n = 11 patches) with superimposed fitted Boltzmann curves. Mean V1/2 derived from the Boltzmann fits are −14.3 mV for Short-QEERL and +2.6 mV for Short-VEDEC.

