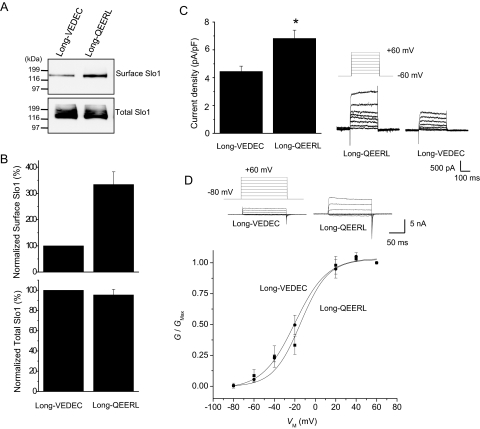
Fig. 5.
Long-QEERL has higher surface expression than Long-VEDEC. A, representative cell-surface biotinylation assays performed in HEK293T cells heterologously expressing Long-VEDEC or Long-QEERL, as in the previous figure. B, summary of densitometric analysis of surface and total expression of Slo1 presented as mean ± S.E.M. from three repetitions of the experiment shown in A. C, representative traces of families of currents obtained by whole-cell recording are shown to the right of a bar graph summarizing the mean ± S.E.M. of whole-cell current densities evoked by step pulses to +60 mV (n = 34 cells). ∗, P < 0.05. D, voltage-dependence of activation determined in inside-out patches from HEK293T cells expressing Long-VEDEC or Long-QEERL. Recordings and voltage activation curves were made from 11 patches, as in the previous figure. Mean V1/2 values derived from the Boltzmann fits are −14.8 mV for Long-QEERL and −20.1 mV for Long-VEDEC.

