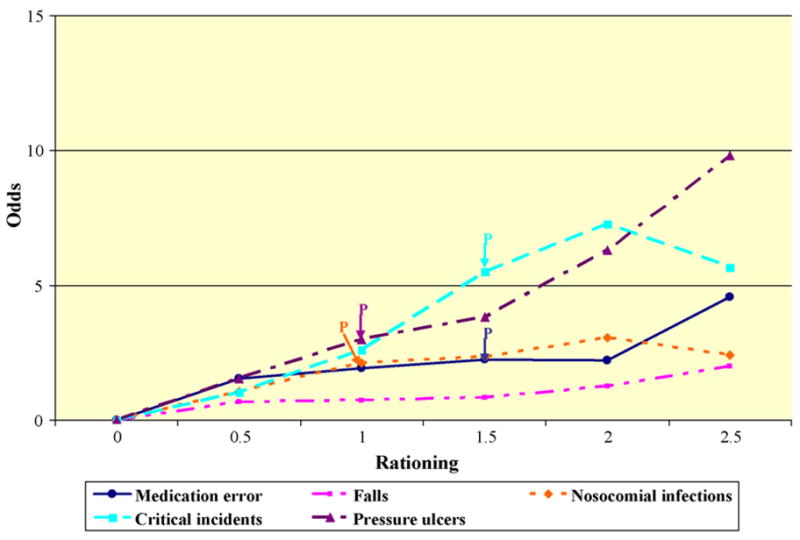
Fig. 2.

Rationing threshold levels for selected patient outcomes, regularly reported over the past year. Note: ‘p’ represents the rationing level at which the accepted level of significance <0.5 was reached and rationing began to affect the particular outcome negatively. Dichotomization of patient outcomes: regularly (sometimes, often) versus never, rarely)
