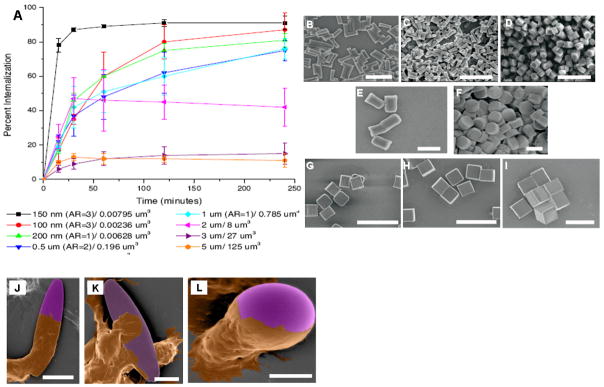
Figure 3. Effects of particle shape and size on cellular internalization.
(A) Internalization profile of PRINT fabricated particles in HeLa cells over 4 hours. The legend indiates particle diameter and volume [57]. (B–I) SEM images of PRINT particles (all composed of 67 wt% trimethylolpropane ethoxylate triacrylate, 20 wt% PEG monomethylether monometharcylate, 10 wt% aminoethyl methacrylate hydrochloride, 2 wt% fluorescein-o-acrylate, and 1 wt% 2,2-diethoxyacetophenone) evaluated in the internalization study shown in panel A (scale bars = 1μm) [57]: (B) 150 by 450 nm particles, (C) 100 by 300 nm particles, (D) 200 by 200 nm particles; (E–F) Cylindrical microparticles that are 1 μm tall but vary in diameter (scale bars = 1 μm): (E) 0.5 μm and (F) 1 μm; (G–I) Cubic microparticles of varying widths (scale bars = 20 μm): (G) 2 μm, (H) 3 μm, and (I) 5 μm; (J–L) Colored SEM images of aveolar marcophages (brown) interacting with different shape polystyrene particles (purple) [62]: (J) cell membrane engulfing the particle; (scale bar = 10μm) (K) cell attaching itself to the flat side of the elliptical particle (scale bar = 5 μm), and (L) the cell membrane progressing around a spherical particle (scale bar = 5 μm).

