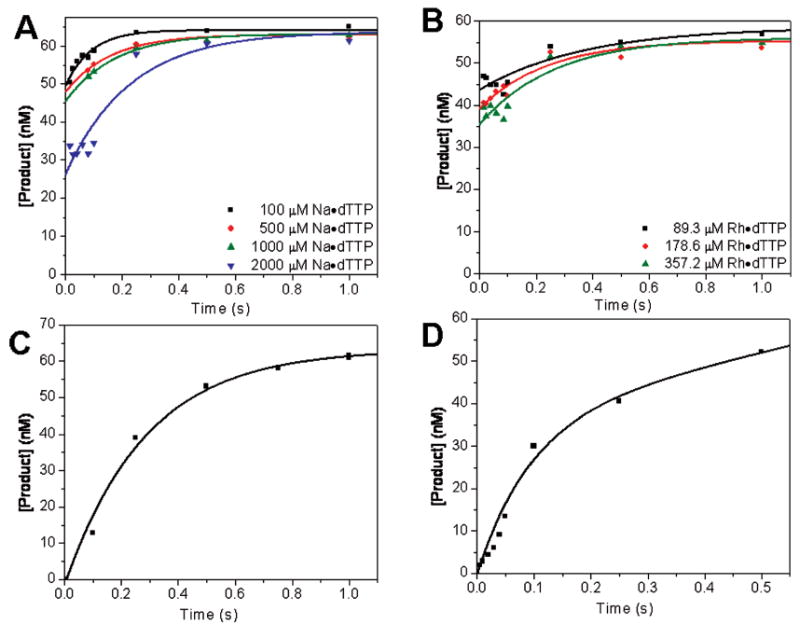
Figure 2.

Pulse-chase, chemical-quench experiment. (A) RB69 pol was preincubated with DNA, then rapidly mixed with various Na·dTTP concentrations, and allowed to incubate for 0.01 s. (B) RB69 pol was preincubated with DNA, then rapidly mixed with various Rh·dTTP concentrations, and allowed to incubate for 0.01 s. (C) RB69 pol was preincubated with DNA, then rapidly mixed with 500 μM dTTP and 4 mM CaCl2, and allowed to incubate for 0.01 s. After preincubation, each reaction mixture was rapidly mixed with MgCl2 and allowed to react for variable amounts of time before the reaction was quenched with 0.5 M EDTA. The data from panels A–C were fit to a single-exponential equation, and the average rates are 8 ± 4, 4 ± 1, and 3.5 ± 0.4 s−1, respectively. (D) dTTP (500 μM) was preincubated with 4 mM CaCl2 and 10 mM MgCl2 and then rapidly mixed with a solution containing RB69 pol, DNA, and 10 mM MgCl2. The reaction was quenched at various times with 0.5 M EDTA, and the data were fit to a burst equation. The burst rate is 11 ± 4 s−1. The final reaction conditions included 100 nM RB69 pol, 90 nM DNA, 50 mM MOPS (pH 7.0), and 10 mM MgCl2.
