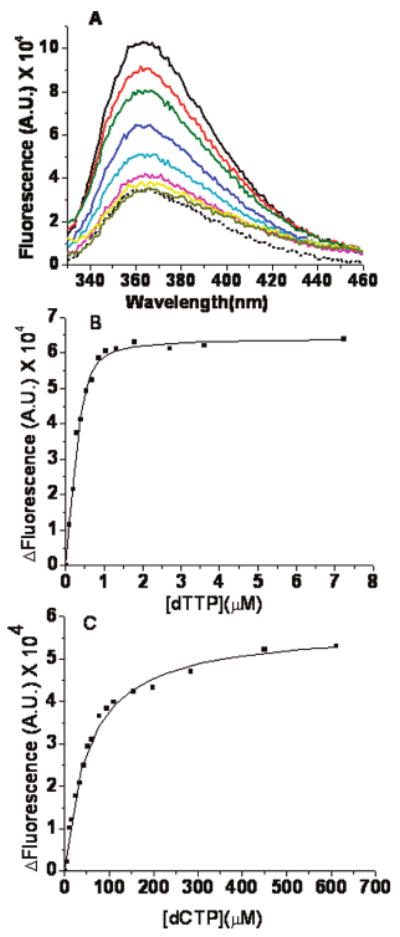
Figure 3.

Equilibrium fluorescence titrations for dTTP or dCTP binding to the RB69 DNA pol–dP/T complex. (A) Representative fluorescence emission spectra of dTTP binding to wild-type RB69 pol in the presence of a 13/20mer dP/T (Table 1), with dAP as the templating base (shown by the solid lines) and 2 mM CaCl2. The concentration of dP/T was 200 nM, and that of RB69 pol was 1 μM. The dTTP concentrations (from top to bottom) were 0, 0.1, 0.2, 0.3, 0.55, 0.9, 2.9, and 7.9 μM. The dotted line is the fluorescence trace for the dP/T alone. (B) dP/T (dAP as the templating base, 200 nM) in the presence of 2 mM Ca2+. The change in fluorescence vs dTTP concentration fit best to a quadratic binding equation with a Kdgapp of 0.053 ± 0.015 μM. (C) dP/T (dAP as the templating base, 200 nM). The change in fluorescence vs dCTP concentration fit best to a hyperbolic equation with a Kdgapp of 53 ± 3 μM. The change in fluorescence (ΔF) is in the direction of quenching. The ΔF of the binary complex is normalized to zero in the absence of dNTP, and the ΔF increases with an increase in dNTP concentration.
