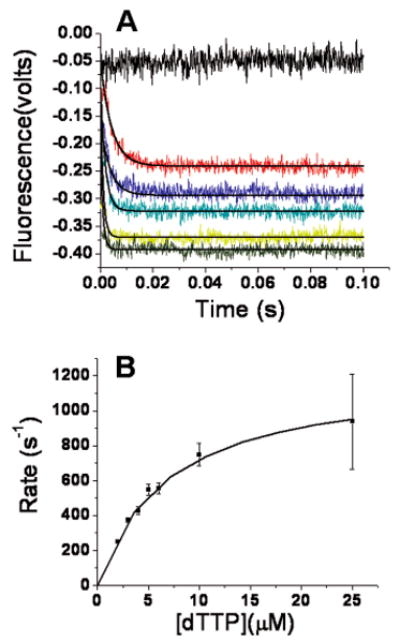
Figure 4.

Stopped-flow fluorescence with dTTP opposite dAP with a dP/T (Table 1). (A) One syringe contained 400 nM DNA and 2 μM RB69 pol in 50 mM MOPS buffer (pH 7) at 24 °C. The other syringe contained varying dTTP concentrations (0, 2, 4, 5, 10, and 25 μM from top to bottom) in 50 mM MOPS buffer (pH 7). Both syringes contained 2 mM CaCl2 and 0.1 mM EDTA. The plots of fluorescence vs time fit a single-exponential equation. The scans are in color, and the fitting curves are in black. (B) The rates from the single exponential vs dTTP concentration fit a hyperbolic equation with a kmax of 1200 ± 50 s−1 and a Kdrapp of 6.8 ± 0.6 μM. The Y-intercept is −10 ± 24 s−1.
