
Figure 5.
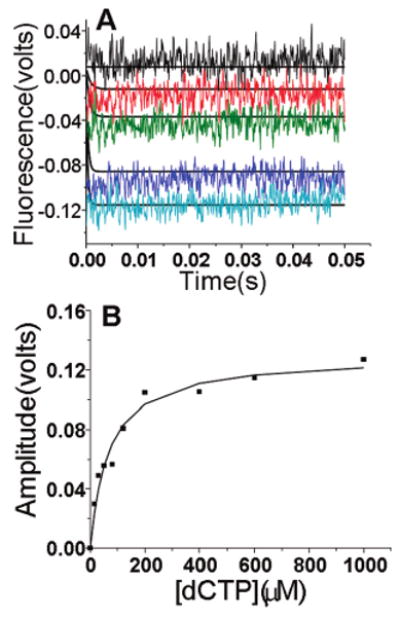
Stopped-flow fluorescence scans with dCTP opposite dAP with a dP/T. (A) One syringe contained 400 nM DNA and 2 μM RB69 pol in 50 mM MOPS buffer (pH 7) at 24 °C. The other syringe contained varying dCTP concentrations (0, 15, 50, 400, and 1000 μM from top to bottom) in MOPS buffer. Both syringes contained 2 mM CaCl2. The fitting plot was obtained from the estimated parameters based on Scheme 2. The experimental scans are in color, and the fitting curves are in black. (B) The amplitude vs dCTP concentration fit a hyperbolic equation with a Kdaapp of 67 ± 12 μM.