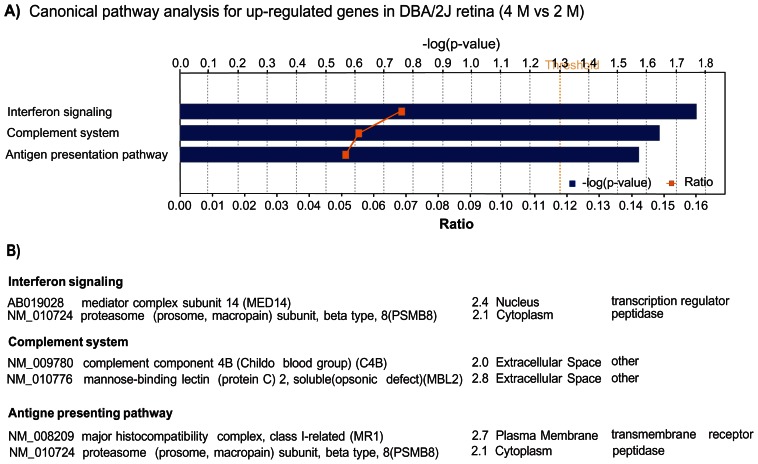
Figure 2.
A) Significantly affected canonical pathways containing up-regulated genes in the retina of D2 mice at the age of 4 M. Bars represent-log (p-value) for over-representation of affected genes in the selected pathway. The yellow line represents the ratio of affected genes to the total number of genes in a pathway. Threshold (grey line) denotes the p = 0.05 level. B) List of genes in each of the pathways.

