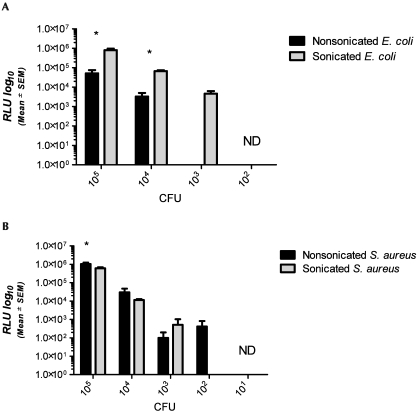
Figure 2.
Signals (RLU, mean ± SEM) detected by the device for nonsonicated and sonicated (A) E. coli and (B) S. aureus at 105,104, 103, 102, and 101 cfu. Detection of E. coli organisms (panel A) was significantly greater (*, P < 0.05) at 105 and 104 cfu when the sample was sonicated before analysis. At 105 cfu, detection of S. aureus (panel B) was significantly (*P < 0.05) greater than that of E. coli. ND, no detection of ATP at this concentration.

