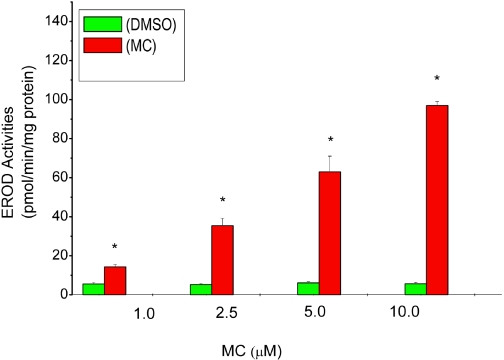
Fig. 1.
Dose-dependent effect of MC on EROD (CYP1A1) activities in HepG2 cells. HepG2 cells were treated with MC at concentrations ranging from 1 to 10 μM or DMSO, as described under Materials and Methods, and EROD activities were determined in the cells 24 h after treatment. Values represent mean ± S.E. (n = 3). *, statistically significant differences between MC- and DMSO-treated cells at P < 0.05.

