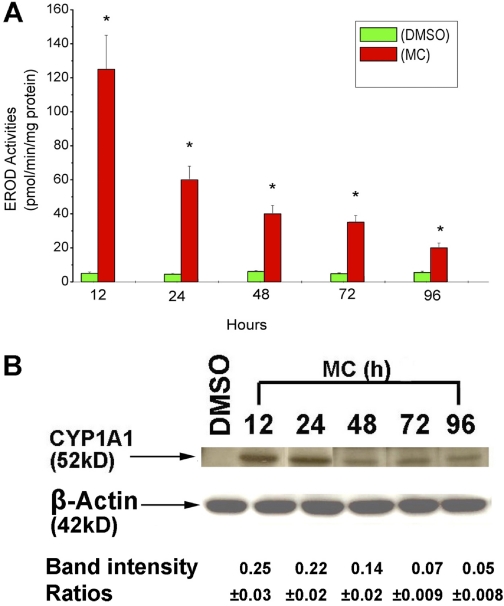
Fig. 2.
Time course of CYP1A1 induction by MC in HepG2 cells. A, HepG2 cells were treated with MC (2.5 μM) or DMSO, and EROD activities were determined in the cells at different time points (12–96 h) after treatment. Values represent mean ± S.E. (n = 3). *, statistically significant differences between MC- and DMSO-treated cells at P < 0.05, as determined by two-way ANOVA. B, HepG2 cells were treated with MC or DMSO, and CYP1A1 apoprotein expression was analyzed in whole cell protein (10 μg) at the indicated time points by Western blotting. Quantitative analyses of the apoprotein contents were conducted by densitometry of the CYP1A1 bands, which were normalized against β-actin controls. Data represent mean ± S.E. of at least three independent treatments of the cells with MC.

