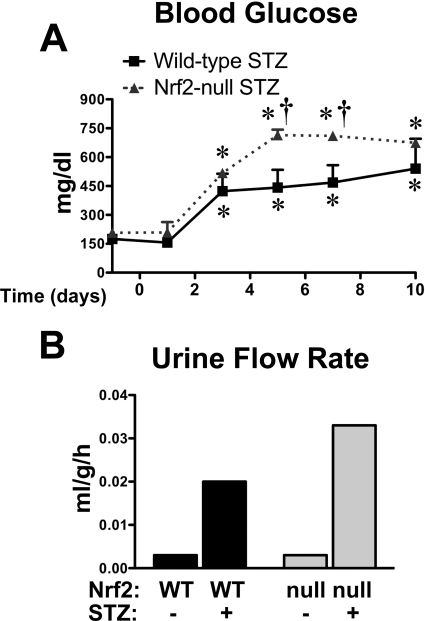
Fig. 2.
Blood glucose and urinary flow rate of wild-type and Nrf2-null mice after STZ. A, blood glucose levels in STZ-treated wild-type and Nrf2-null mice from days −1 to 10. STZ was administered on day 0. Day −1 blood glucose levels represent pretreatment values. Black bars represent wild-type mice, and gray bars represent Nrf2-null mice. Data are presented as mean ± S.E. (n = 4–6). Asterisks (∗) represent statistically significant differences (p < 0.05) compared with control mice for each genotype. Daggers (†) represent a statistically significant difference (p < 0.05) between wild-type and Nrf2-null mice at that time point. B, urinary flow rate of control and STZ-treated WT and Nrf2-null mice on day 9. Urine volume was quantified from three mice per group housed in a single metabolic cage (pooled urine) for 6 h and normalized to body weight and time. Black bars represent wild-type mice, and gray bars represent Nrf2-null mice.

