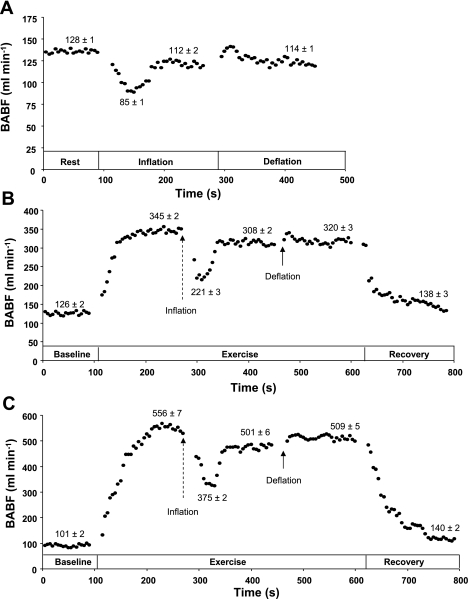
Fig. 5.
Typical blood flow response. A sample tracing of FBF [i.e., brachial artery blood flow (BABF)] in 5-s averages (•) under resting conditions (A) and during exercise at 10% (B) and 20% (C) of maximal voluntary contraction. Arrows indicate start of balloon inflation (dashed) and deflation (solid).

