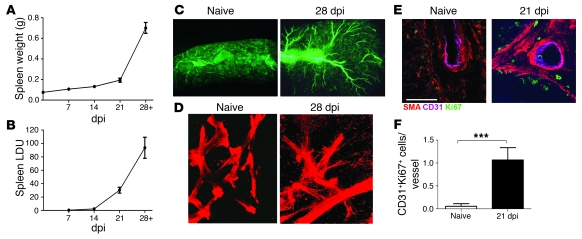
Figure 1. Vascular remodeling in L. donovani–infected spleens.
(A and B) Spleen weights (A) and parasite burdens (B) measured during the course of infection. Data are mean ± SEM from 3 independent experiments (n = 8–10 per time point). (C) Splenic vasculature, visualized by FITC-dextran angiography, of naive versus infected (28 dpi) mice. Original magnification, ×12. (D) Whole mount staining of α-SMA+ vasculature (red) in spleens from naive and 28-dpi mice. Images from Supplemental Videos 1 and 2 are shown. Original magnification, ×200. (E) Proliferation of vascular endothelial cells in infected mice, but not naive mice, analyzed by immunostaining of frozen spleen sections with CD31 (blue/purple), α-SMA (red), and the proliferation marker Ki67 (green). Scale bar: 100 μm. (F) Quantification of large-caliber vessels counted for CD31+Ki67+ cells. At least 4 vessels were counted per spleen section. Data are mean ± SEM of at least 2 independent experiments (n = 3 per time point). ***P = 0.0003.

