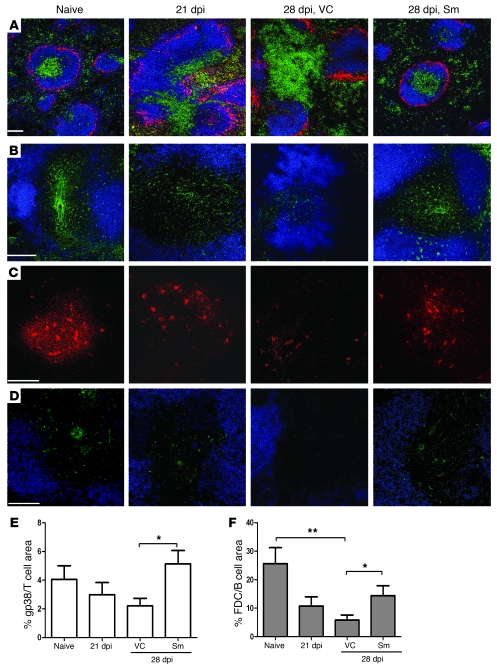
Figure 5. RTKI treatment restores pathogen-induced disruption of splenic architecture.
(A) Immunofluorescent staining of frozen spleen sections (10 μm) before and after treatment with Sm showing localization of B cells (B220, blue), T cells (CD3, green), and MMM (MOMA-1, red). (B) Splenic T cell zones depicting FRC (gp38, green) and B cells (B220, blue). (C) Expression of FDC (FDCM1, red) in B cell follicles. (D) CCL21 (green) in T cell zones with B cells (B220, blue). Scale bars: 100 μm. (E and F) Area of gp38 staining in the T cell areas (E) and FDCM1 staining in B cell areas (F) after Sm treatment, determined using computer-assisted morphometric analysis. Data are mean ± SEM of at least 2 independent experiments (n = 3 per time point). *P < 0.05, **P < 0.01.

