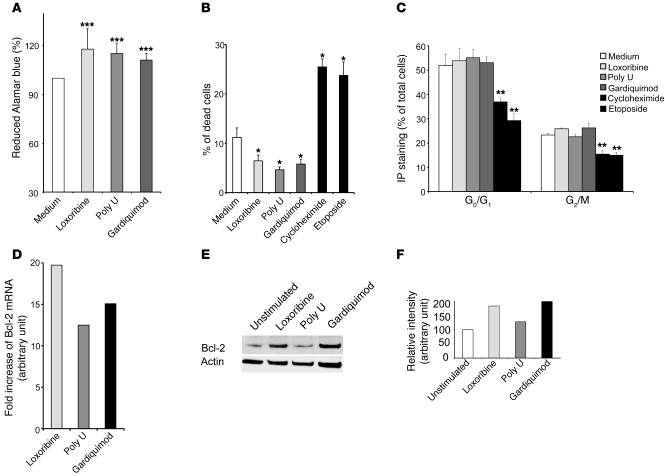
Figure 5. TLR7 and TLR8 induce survival of lung tumor cells.
(A) A549 cells were unstimulated or stimulated with loxoribine (10 μg/ml), poly U (10 μg/ml), or Gardiquimod (10 μg/ml) and incubated with Alamar blue for 10 days. Reduction of Alamar blue was then determined by spectrophotometry at 570 and 600 nm. The percentage of reduced Alamar blue was calculated as described by the manufacturer. (B) A549 cells were unstimulated or stimulated with loxoribine, poly U, Gardiquimod, etoposide, or cycloheximide for 24 hours. The percentage of dead cells was determined by Trypan blue exclusion. (C) DNA content was measured by IP staining after RNAse A treatment. Percentages indicate the proportion of subdiploid (G0/G1) and diploid cells (G2/M). Data in A–C represent mean ± SD from 3 independent experiments. *P < 0.05, **P < 0.01, ***P < 0.001 versus medium, Student’s t test. (D) A549 cells were cultured for 6 hours in the presence of loxoribine, poly U, or Gardiquimod, and the expression of Bcl-2 was assayed using TaqMan Low-Density Array technology. The fold increase (arbitrary units) was obtained by 2–ΔΔCT. (E and F) A549 cells were cultured for 36 hours in the presence of loxoribine, poly U, or Gardiquimod. (E) Cell lysates were analyzed by immunoblot with anti–Bcl-2 and anti-actin antibodies. (F) Quantification of the bands was realized using Image J software. Histograms represent the intensity of the respective band, expressed as relative intensity normalized to actin. Results are representative of 3 independent experiments.

